
Page 557 - MARSIUM'21 COMP OF PAPER
P. 557
536 Nor Khairena binti Khalid (2022)
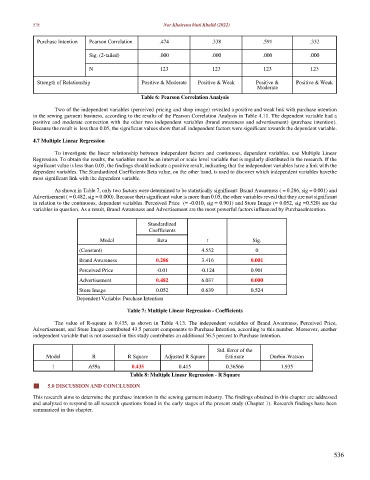
Purchase Intention Pearson Correlation .474 .338 .591 .332
Sig. (2-tailed) .000 .000 .000 .000
N 123 123 123 123
Strength of Relationship Positive & Moderate Positive & Weak Positive & Positive & Weak
Moderate
Table 6: Pearson Correlation Analysis
Two of the independent variables (perceived pricing and shop image) revealed a positive and weak link with purchase intention
in the sewing garment business, according to the results of the Pearson Correlation Analysis in Table 4.11. The dependent variable had a
positive and moderate connection with the other two independent variables (brand awareness and advertisement) (purchase intention).
Because the result is less than 0.05, the significant values show that all independent factors were significant towards the dependent variable.
4.7 Multiple Linear Regression
To investigate the linear relationship between independent factors and continuous, dependent variables, use Multiple Linear
Regression. To obtain the results, the variables must be an interval or scale level variable that is regularly distributed in the research. If the
significant value is less than 0.05, the findings should indicate a positive result, indicating that the independent variables have a link with the
dependent variables. The Standardized Coefficients Beta value, on the other hand, is used to discover which independent variables have the
most significant link with the dependent variable.
As shown in Table 7, only two factors were determined to be statistically significant: Brand Awareness ( = 0.286, sig = 0.001) and
Advertisement ( = 0.482, sig = 0.000). Because their significant value is more than 0.05, the other variables reveal that they are not significant
in relation to the continuous, dependent variables. Perceived Price (= -0.010, sig = 0.901) and Store Image (= 0.052, sig = 0.520) are the
variables in question. As a result, Brand Awareness and Advertisement are the most powerful factors influenced by Purchase Intention.
Standardized
Coefficients
Model Beta t Sig.
(Constant) 4.552 0
Brand Awareness 0.286 3.416 0.001
Perceived Price -0.01 -0.124 0.901
Advertisement 0.482 6.037 0.000
Store Image 0.052 0.639 0.524
Dependent Variable: Purchase Intention
Table 7: Multiple Linear Regression - Coefficients
The value of R-square is 0.435, as shown in Table 4.13. The independent variables of Brand Awareness, Perceived Price,
Advertisement, and Store Image contributed 43.5 percent components to Purchase Intention, according to this number. Moreover, another
independent variable that is not assessed in this study contributes an additional 56.5 percent to Purchase Intention.
Std. Error of the
Model R R Square Adjusted R Square Estimate Durbin-Watson
1 .659a 0.435 0.415 0.36566 1.935
Table 8: Multiple Linear Regression - R Square
⬛ 5.0 DISCUSSION AND CONCLUSION
This research aims to determine the purchase intention in the sewing garment industry. The findings obtained in this chapter are addressed
and analyzed to respond to all research questions found in the early stages of the present study (Chapter 1). Research findings have been
summarized in this chapter.
536