
Page 619 - MARSIUM'21 COMP OF PAPER
P. 619
598 Nur Fazira & Dr Adaviah (2022)
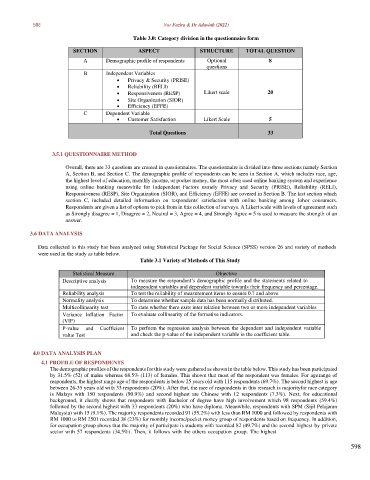
Table 3.0: Category division in the questionnaire form
SECTION ASPECT STRUCTURE TOTAL QUESTION
A Demographic profile of respondents Optional 8
questions
B Independent Variables
• Privacy & Security (PRISE)
• Reliability (RELI)
• Responsiveness (RESP) Likert scale 20
• Site Organization (SIOR)
• Efficiency (EFFE)
C Dependent Variable
• Customer Satisfaction Likert Scale 5
Total Questions 33
3.5.1 QUESTIONNAIRE METHOD
Overall, there are 33 questions are created in questionnaires. The questionnaire is divided into three sections namely Section
A, Section B, and Section C. The demographic profile of respondents can be seen in Section A, which includes race, age,
the highest level of education, monthly income, or pocket money, the most often used online banking system and experience
using online banking meanwhile for Independent Factors namely Privacy and Security (PRISE), Reliability (RELI),
Responsiveness (RESP), Site Organization (SIOR), and Efficiency (EFFE) are covered in Section B. The last section which
section C, included detailed information on respondents' satisfaction with online banking among Johor consumers.
Respondents are given a list of options to pick from in this collection of surveys. A Likert scale with levels of agreement such
as Strongly disagree = 1, Disagree = 2, Neutral = 3, Agree = 4, and Strongly Agree = 5 is used to measure the strength of an
answer.
3.6 DATA ANALYSIS
Data collected in this study has been analyzed using Statistical Package for Social Science (SPSS) version 26 and variety of methods
were used in the study as table below.
Table 3.1 Variety of Methods of This Study
Statistical Measure Objective
Descriptive analysis To measure the respondent’s demographic profile and the statements related to
independent variables and dependent variable towards their frequency and percentage.
Reliability analysis To test the reliability of measurement items to ensure 0.7 and above
Normality analysis To determine whether sample data has been normally distributed.
Multicollinearity test To state whether there exits inter relation between two or more independent variables
Variance Inflation Factor To evaluate collinearity of the formative indicators.
(VIF)
P-value and Coefficient To perform the regression analysis between the dependent and independent variable
value Test and check the p-value of the independent variable in the coefficient table.
4.0 DATA ANALYSIS PLAN
4.1 PROFILE OF RESPONDENTS
The demographic profiles of the respondents for this study were gathered as shown in the table below. This study has been participated
by 31.5% (52) of males whereas 68.5% (113) of females. This shown that most of the respondent was females. For age range of
respondents, the highest range age of the respondents is below 25 years old with 115 respondents (69.7%). The second highest is age
between 26-35 years old with 33 respondents (20%). After that, the race of respondents in this research is majority for race category
is Malays with 150 respondents (90.9%) and second highest are Chinese with 12 respondents (7.3%). Next, for educational
background, it clearly shows that respondents with Bachelor of degree have high involvement which 98 respondents (59.4%)
followed by the second highest with 33 respondents (20%) who have diploma. Meanwhile, respondents with SPM (Sijil Pelajaran
Malaysia) with 15 (9.1%). The majority respondents recorded 91 (55.2%) with less than RM 1000 and followed by respondents with
RM 1000 to RM 2501 recorded 38 (23%) for monthly income/pocket money group of respondents based on frequency. In addition,
for occupation group shows that the majority of participate is students with recorded 82 (49.7%) and the second highest by private
sector with 57 respondents (34.5%). Then, it follows with the others occupation group. The highest
598