
Page 636 - MARSIUM'21 COMP OF PAPER
P. 636
615
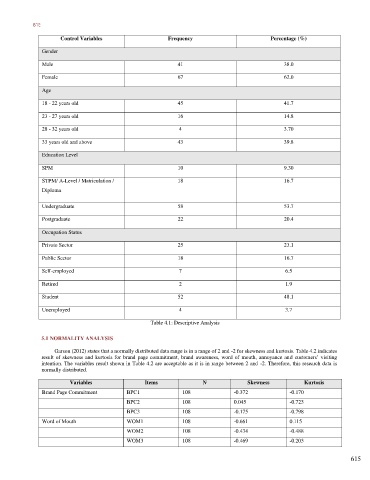
Control Variables Frequency Percentage (%)
Gender
Male 41 38.0
Female 67 62.0
Age
18 - 22 years old 45 41.7
23 - 27 years old 16 14.8
28 - 32 years old 4 3.70
33 years old and above 43 39.8
Education Level
SPM 10 9.30
STPM/ A-Level / Matriculation / 18 16.7
Diploma
Undergraduate 58 53.7
Postgraduate 22 20.4
Occupation Status
Private Sector 25 23.1
Public Sector 18 16.7
Self-employed 7 6.5
Retired 2 1.9
Student 52 48.1
Unemployed 4 3.7
Table 4.1: Descriptive Analysis
5.1 NORMALITY ANALYSIS
Garson (2012) states that a normally distributed data range is in a range of 2 and -2 for skewness and kurtosis. Table 4.2 indicates
result of skewness and kurtosis for brand page commitment, brand awareness, word of mouth, annoyance and customers’ visiting
intention. The variables result shown in Table 4.2 are acceptable as it is in range between 2 and -2. Therefore, this research data is
normally distributed.
Variables Items N Skewness Kurtosis
Brand Page Commitment BPC1 108 -0.372 -0.170
BPC2 108 0.045 -0.723
BPC3 108 -0.175 -0.798
Word of Mouth WOM1 108 -0.661 0.115
WOM2 108 -0.434 -0.488
WOM3 108 -0.469 -0.203
615