Page 649 - MARSIUM'21 COMP OF PAPER
P. 649

Qamarina & Zuraidah (2022)
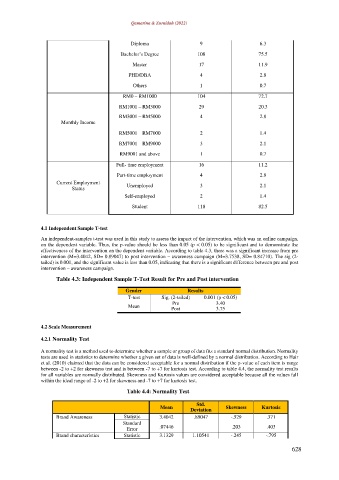


                                               Diploma                 9                    6.3
                                           Bachelor’s Degree          108                   75.5

                                                Master                 17                   11.9
                                              PHD/DBA                  4                    2.8
                                                Others                 1                    0.7
                                            RM0 – RM1000              104                   72.7

                                           RM1001 – RM3000             29                   20.3
                                           RM3001 – RM5000             4                    2.8
                       Monthly Income
                                           RM5001 – RM7000             2                    1.4

                                           RM7001 – RM9000             3                    2.1

                                           RM9001 and above            1                    0.7
                                          Full- time employment        16                   11.2

                                          Part-time employment         4                    2.8
                     Current Employment       Unemployed               3                    2.1
                          Status
                                             Self-employed             2                    1.4

                                               Student                118                   82.5

               4.1 Independent Sample T-test

               An independent-samples t-test was used in this study to assess the impact of the intervention, which was an online campaign,
               on the dependent variable. Thus, the p-value should be less than 0.05 (p < 0.05) to be significant and to demonstrate the
               effectiveness of the intervention on the dependent variable. According to table 4.3, there was a significant increase from pre
               intervention (M=3.4042, SD= 0.89047) to post intervention – awareness campaign (M=3.7538, SD= 0.84710). The sig (2-
               tailed) is 0.001, and the significant value is less than 0.05, indicating that there is a significant difference between pre and post
               intervention – awareness campaign.
                     Table 4.3: Independent Sample T-Test Result for Pre and Post intervention

                                             Gender                Results
                                              T-test      Sig. (2-tailed)   0.001 (p < 0.05)
                                                              Pre            3.40
                                              Mean           Post            3.75

               4.2 Scale Measurement

               4.2.1 Normality Test

               A normality test is a method used to determine whether a sample or group of data fits a standard normal distribution. Normality
               tests are used in statistics to determine whether a given set of data is well-defined by a normal distribution. According to Hair
               et al. (2010) claimed that the data can be considered acceptable for a normal distribution if the p-value of each item is range
               between -2 to +2 for skewness test and is between -7 to +7 for kurtosis test. According to table 4.4, the normality test results
               for all variables are normally distributed. Skewness and Kurtosis values are considered acceptable because all the values fall
               within the ideal range of -2 to +2 for skewness and -7 to +7 for kurtosis test.
                                              Table 4.4: Normality Test

                                                                      Std.
                                                         Mean                   Skewness     Kurtosis
                                                                    Deviation
                     Brand Awareness         Statistic   3.4042      .89047       -.529        .371
                                            Standard
                                              Error      .07446                   .203         .403
                     Brand characteristics   Statistic   3.1329      1.10541      -.245       -.795

                                                                                                        628
   644   645   646   647   648   649   650   651   652   653   654