
Page 648 - MARSIUM'21 COMP OF PAPER
P. 648
Qamarina & Zuraidah (2022)
Table 4.1: Statistical Techniques
Variable Type
Research Objective Dependent Statistical
Independent Variable Measure
Variable
To identify the relationships of brand Brand Characteristics,
characteristic, advertising, and sales Advertising, Sales Brand Awareness Multiple
promotion with brand awareness of Clayniq Regression
products. Promotion
Multiple
To identify the most important factors that Brand Characteristics, Regression
influence brand awareness of Clayniq Advertising, Sales Brand Awareness (Beta
products. Promotion Coefficient)
To examine whether online campaigns can Intervention strategy: Independent
help to improve brand awareness of Clayniq online campaign Brand Awareness Sample T-test
products.
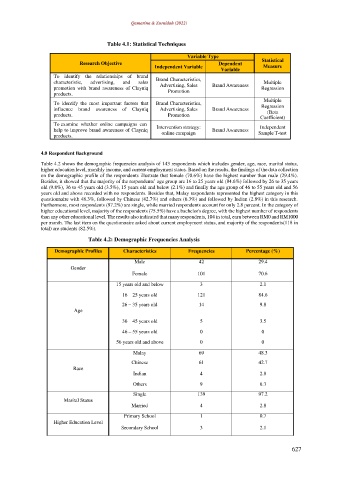
4.0 Respondent Background
Table 4.2 shows the demographic frequencies analysis of 143 respondents which includes gender, age, race, marital status,
higher education level, monthly income, and current employment status. Based on the results, the findings of the data collection
on the demographic profile of the respondents illustrate that female (70.6%) have the highest number than male (29.4%).
Besides, it showed that the majority of the respondents’ age group are 16 to 25 years old (84.6%) followed by 26 to 35 years
old (9.8%), 36 to 45 years old (3.5%), 15 years old and below (2.1%) and finally the age group of 46 to 55 years old and 56
years old and above recorded with no respondents. Besides that, Malay respondents represented the highest category in this
questionnaire with 48.3%, followed by Chinese (42.7%) and others (6.3%) and followed by Indian (2.8%) in this research.
Furthermore, most respondents (97.2%) are single, while married respondents account for only 2.8 percent. In the category of
higher educational level, majority of the respondents (75.5%) have a bachelor's degree, with the highest number of respondents
than any other educational level. The results also indicated that many respondents, 104 in total, earn between RM0 and RM1000
per month. The last item on the questionnaire asked about current employment status, and majority of the respondents (118 in
total) are students (82.5%).
Table 4.2: Demographic Frequencies Analysis
Demographic Profiles Characteristics Frequencies Percentage (%)
Male 42 29.4
Gender
Female 101 70.6
15 years old and below 3 2.1
16 – 25 years old 121 84.6
26 – 35 years old 14 9.8
Age
36 – 45 years old 5 3.5
46 – 55 years old 0 0
56 years old and above 0 0
Malay 69 48.3
Chinese 61 42.7
Race
Indian 4 2.8
Others 9 6.3
Single 139 97.2
Marital Status
Married 4 2.8
Primary School 1 0.7
Higher Education Level
Secondary School 3 2.1
627