
Page 746 - MARSIUM'21 COMP OF PAPER
P. 746
725
Based on the calculation above, the minimum number of respondents is 95. However, in this research, the researcher succeeds to achieve
more than the minimum number of respondents which is 123 respondents.
3.4 Data Collection Method
In this research, researcher use primary data by using questionnaire. Researchers use Google Form to collect the respondent’s data.
3.5 Research Instrument
The questionnaire is the most frequently used instrument for collecting research data from the research participants. In this research,
researcher use Google Form to collect the data from the respondents. The questionnaire is divided into six sections: Section A, B, C, D, E,
and F. Section A contains demographic information. Section B is for the independent variable of direct marketing, Section C is for the
independent variable of social media, Section D is for the independent variable of advertising, Section E is for the independent variable of
sales promotion, and Section F is for the dependent variable of consumer buying behavior.
3.6 Data Analysis Design
In this research, researcher use Statistical Package for the Social Science (SPSS) version 26 to analyze the data.
3.7 Data Analysis Method
Type of Analysis Definition
Descriptive analysis Descriptive analysis is the process of using statistical technique to describe or
summarize a set of data.
Normality Test Normality test is specific statistical distribution called a normal distribution.
Reliability Test Reliability tests refer to the extent to which a test measures without error. It is
highly related to test validity.
Multiple Regression Multiple regression is a statistical technique that uses several explanatory
variables to predict the outcome of a response variable.
■ 4.0 DATA ANALYSIS PLAN
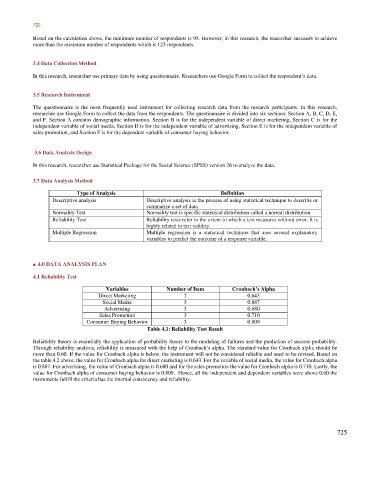
4.1 Reliability Test
Variables Number of Item Cronbach’s Alpha
Direct Marketing 2 0.643
Social Media 3 0.887
Advertising 3 0.680
Sales Promotion 3 0.710
Consumer Buying Behavior 3 0.809
Table 4.1: Reliability Test Result
Reliability theory is essentially the application of probability theory to the modeling of failures and the prediction of success probability.
Through reliability analysis, reliability is measured with the help of Cronbach’s alpha. The standard value for Cronbach alpha should be
more than 0.60. If the value for Cronbach alpha is below, the instrument will not be considered reliable and need to be revised. Based on
the table 4.2 above, the value for Cronbach alpha for direct marketing is 0.643. For the variable of social media, the value for Cronbach alpha
is 0.887. For advertising, the value of Cronbach alpha is 0.680 and for the sales promotion the value for Cronbach alpha is 0.710. Lastly, the
value for Cronbach alpha of consumer buying behavior is 0.809. Hence, all the independent and dependent variables were above 0.60 the
instruments fulfill the criteria has the internal consistency and reliability.
725