
Page 747 - MARSIUM'21 COMP OF PAPER
P. 747
726
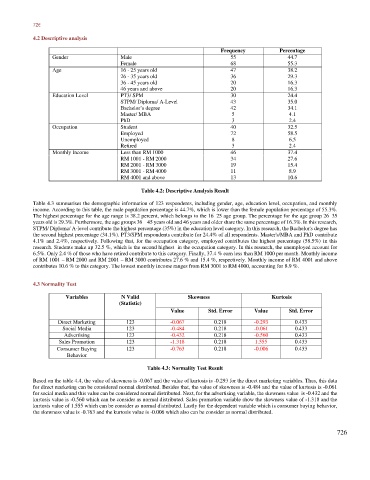
4.2 Descriptive analysis
Frequency Percentage
Gender Male 55 44.7
Female 68 55.3
Age 16 - 25 years old 47 38.2
26 - 35 years old 36 29.3
36 - 45 years old 20 16.3
46 years and above 20 16.3
Education Level PT3/ SPM 30 24.4
STPM/ Diploma/ A-Level 43 35.0
Bachelor’s degree 42 34.1
Master/ MBA 5 4.1
PhD 3 2.4
Occupation Student 40 32.5
Employed 72 58.5
Unemployed 8 6.5
Retired 3 2.4
Monthly Income Less than RM 1000 46 37.4
RM 1001 - RM 2000 34 27.6
RM 2001 - RM 3000 19 15.4
RM 3001 - RM 4000 11 8.9
RM 4001 and above 13 10.6
Table 4.2: Descriptive Analysis Result
Table 4.3 summarises the demographic information of 123 respondents, including gender, age, education level, occupation, and monthly
income. According to this table, the male population percentage is 44.7%, which is lower than the female population percentage of 55.3%.
The highest percentage for the age range is 38.2 percent, which belongs to the 16–25 age group. The percentage for the age group 26–35
years old is 29.3%. Furthermore, the age groups 36 – 45 years old and 46 years and older share the same percentage of 16.3%. In this research,
STPM/ Diploma/ A-level contribute the highest percentage (35%) in the education level category. In this research, the Bachelor's degree has
the second highest percentage (34.1%). PT3/SPM respondents contribute for 24.4% of all respondents. Master's/MBA and PhD contribute
4.1% and 2.4%, respectively. Following that, for the occupation category, employed contributes the highest percentage (58.5%) in this
research. Students make up 32.5 %, which is the second highest in the occupation category. In this research, the unemployed account for
6.5%. Only 2.4 % of those who have retired contribute to this category. Finally, 37.4 % earn less than RM 1000 per month. Monthly income
of RM 1001 – RM 2000 and RM 2001 – RM 3000 contributes 27.6 % and 15.4 %, respectively. Monthly income of RM 4001 and above
contributes 10.6 % to this category. The lowest monthly income ranges from RM 3001 to RM 4000, accounting for 8.9 %.
4.3 Normality Test
Variables N Valid Skewness Kurtosis
(Statistic)
Value Std. Error Value Std. Error
Direct Marketing 123 -0.067 0.218 -0.293 0.433
Social Media 123 -0.484 0.218 -0.061 0.433
Advertising 123 -0.432 0.218 -0.560 0.433
Sales Promotion 123 -1.318 0.218 1.555 0.433
Consumer Buying 123 -0.763 0.218 -0.006 0.433
Behavior
Table 4.3: Normality Test Result
Based on the table 4.4, the value of skewness is -0.067 and the value of kurtosis is -0.293 for the direct marketing variables. Thus, this data
for direct marketing can be considered normal distributed. Besides that, the value of skewness is -0.484 and the value of kurtosis is -0.061
for social media and this value can be considered normal distributed. Next, for the advertising variable, the skewness value is -0.432 and the
kurtosis value is -0.560 which can be consider as normal distributed. Sales promotion variable show the skewness value of -1.318 and the
kurtosis value of 1.555 which can be consider as normal distributed. Lastly for the dependent variable which is consumer buying behavior,
the skewness value is -0.763 and the kurtosis value is -0.006 which also can be consider as normal distributed.
726