
Page 813 - MARSIUM'21 COMP OF PAPER
P. 813
792 Suhailiey & Adaviah (2022)
4.3 Descriptive Analysis
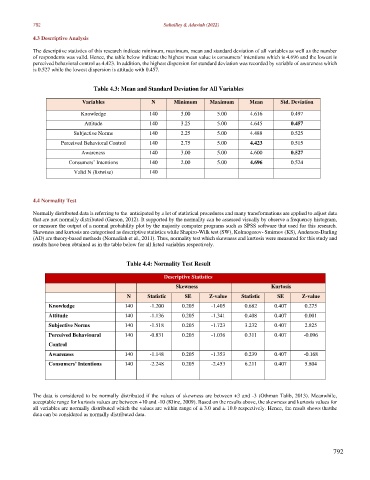
The descriptive statistics of this research indicate minimum, maximum, mean and standard deviation of all variables as well as the number
of respondents was valid. Hence, the table below indicate the highest mean value is consumers’ intentions which is 4.696 and the lowest is
perceived behavioral control as 4.423. In addition, the highest dispersion for standard deviation was recorded by variable of awareness which
is 0.527 while the lowest dispersion is attitude with 0.457.
Table 4.3: Mean and Standard Deviation for All Variables
Variables N Minimum Maximum Mean Std. Deviation
Knowledge 140 3.00 5.00 4.616 0.497
Attitude 140 3.25 5.00 4.645 0.457
Subjective Norms 140 2.25 5.00 4.488 0.525
Perceived Behavioral Control 140 2.75 5.00 4.423 0.515
Awareness 140 3.00 5.00 4.600 0.527
Consumers’ Intentions 140 2.00 5.00 4.696 0.524
Valid N (listwise) 140
4.4 Normality Test
Normally distributed data is referring to the anticipated by a lot of statistical procedures and many transformations are applied to adjust data
that are not normally distributed (Garson, 2012). It supported by the normality can be assessed visually by observe a frequency histogram,
or measure the output of a normal probability plot by the majority computer programs such as SPSS software that used for this research.
Skewness and kurtosis are categorised as descriptive statistics while Shapiro-Wilk test (SW), Kolmogorov- Smirnov (KS), Anderson-Darling
(AD) are theory-based methods (Nornadiah et al., 2011). Thus, normality test which skewness and kurtosis were measured for this study and
results have been obtained as in the table below for all listed variables respectively.
Table 4.4: Normality Test Result
Descriptive Statistics
Skewness Kurtosis
N Statistic SE Z-value Statistic SE Z-value
Knowledge 140 -1.200 0.205 -1.405 0.682 0.407 0.275
Attitude 140 -1.136 0.205 -1.341 0.408 0.407 0.001
Subjective Norms 140 -1.518 0.205 -1.723 3.232 0.407 2.825
Perceived Behavioural 140 -0.831 0.205 -1.036 0.311 0.407 -0.096
Control
Awareness 140 -1.148 0.205 -1.353 0.239 0.407 -0.168
Consumers’ Intentions 140 -2.248 0.205 -2.453 6.211 0.407 5.804
The data is considered to be normally distributed if the values of skewness are between +3 and -3 (Othman Talib, 2013). Meanwhile,
acceptable range for kurtosis values are between +10 and -10 (Kline, 2009). Based on the results above, the skewness and kurtosis values for
all variables are normally distributed which the values are within range of ± 3.0 and ± 10.0 respectively. Hence, the result shows that the
data can be considered as normally distributed data.
792