
Page 816 - MARSIUM'21 COMP OF PAPER
P. 816
795 Suhailiey & Adaviah (2022)
4.7 Multiple Regression Analysis
Multiple Regression is use in this research which to study the relationship between dependent variable and independent variables. Multiple
regression analysis was performed in this study in order to find out which is the strongest predictor that motivate consumers’ intentions
towards fraudulent dietary supplements and observed into the beta coefficient value and the largest value which most significant variable for
this research accordingly.
4.7.1 Model Summary of Variables
Table 4.8: Model Summary
Model R R Square Adjusted R Square Std. Error of the Estimate
1 0.629 a 0.396 0.374 0.41438
a. Predictors: (Constant), Awareness, Perceived Behavioural Control, Subjective Norms, Knowledge, Attitude
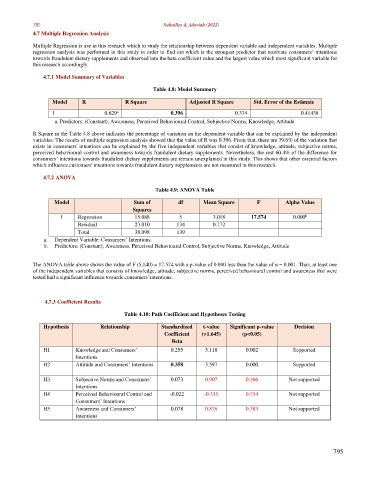
R Square in the Table 4.8 above indicates the percentage of variation on the dependent variable that can be explained by the independent
variables. The results of multiple regression analysis showed that the value of R was 0.396. From that, there are 39.6% of the variation that
exists in consumers' intentions can be explained by the five independent variables that consist of knowledge, attitude, subjective norms,
perceived behavioural control and awareness towards fraudulent dietary supplements. Nevertheless, the rest 60.4% of the difference for
consumers’ intentions towards fraudulent dietary supplements are remain unexplained in this study. This shows that other essential factors
which influence customers' intentions towards fraudulent dietary supplements are not measured in this research.
4.7.2 ANOVA
Table 4.9: ANOVA Table
Model Sum of df Mean Square F Alpha Value
Squares
b
1 Regression 15.088 5 3.018 17.574 0.000
Residual 23.010 134 0.172
Total 38.098 139
a. Dependent Variable: Consumers’ Intentions
b. Predictors: (Constant), Awareness, Perceived Behavioural Control, Subjective Norms, Knowledge, Attitude
The ANOVA table above shows the value of F (5,140) = 17.574 with a p-value of 0.000 less than the value of α = 0.001. Thus, at least one
of the independent variables that consists of knowledge, attitude, subjective norms, perceived behavioural control and awareness that were
tested had a significant influence towards consumers' intentions.
4.7.3 Coefficient Results
Table 4.10: Path Coefficient and Hypotheses Testing
Hypothesis Relationship Standardized t-value Significant p-value Decision
Coefficient (>1.645) (p<0.05)
Beta
H1 Knowledge and Consumers’ 0.255 3.118 0.002 Supported
Intentions
H2 Attitude and Consumers’ Intentions 0.358 3.597 0.000 Supported
H3 Subjective Norms and Consumers’ 0.073 0.907 0.366 Not supported
Intentions
H4 Perceived Behavioural Control and -0.022 -0.315 0.754 Not supported
Consumers’ Intentions
H5 Awareness and Consumers’ 0.078 0.876 0.383 Not supported
Intentions
795