
Page 913 - MARSIUM'21 COMP OF PAPER
P. 913
914 Tan Yi Ting & Dr Adaviah (2022)
3.4 RESEARCH INSTRUMENT
Research can appear in 2 categories such as quantitative research or qualitative research. Quantitative
research involves formal, systematic measurement and statistical analyses to obtain findings of a study.
On the other hand, most of the qualitative researchers agreed with the observation of (Snider, 2010)
that qualitative research can be conducted through interviews and observations which does not analyze
the findings through formal statistical analyses. Thus, researcher employs the quantitative method via
survey methods by using the questionnaires. The questionnaire in this study consists of Part A which
involves 8 questions related to respondents’ demographic profile whereas Part B consists of 22
questions related to the effect of reference price toward customer purchase intention. The five-points
Likert scale was applied in Part B, so that the respondents can answer the questions based on their level
of agreement. It will be distributed to the targeted respondents by using the google form.
4.0 DATA ANALYSIS
Data analysis is a process of evaluating data collected by using analytical and statistical tools to obtain
useful outcomes for decision making. The statistical techniques will be used for data analysis including
pilot test, descriptive analysis, normality test, reliability test and multiple regression. All of these
quantitative data collected will transfer to SPSS software version 26.0 to obtain the findings.
4.1. (PRE-TEST) PILOT TEST
As mentioned by the study of Whitehead et al., (2015), the pilot test can reduce early problems or
errors as it could help researcher to refine and clarify the questionnaire. The respondents were given
questionnaires by Google Form and researcher will request the respondents to note the problems or
difficulties facing while completing this questionnaire. Based on the pilot test result, the questionnaire
will be re-modified. Browne (1995) also mentioned that at least 30 or more participants must be used
to conduct the pilot test. Thus, researcher will distribute 30 sets of questionnaires to the customers at
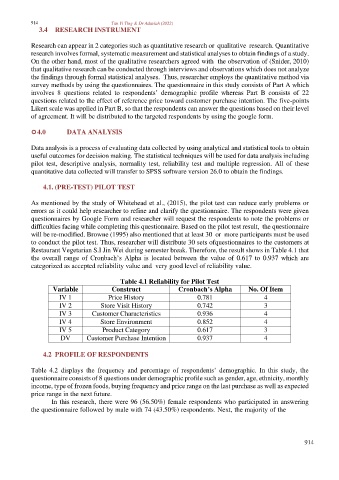
Restaurant Vegetarian S.I Jin Wei during semester break. Therefore, the result shows in Table 4.1 that
the overall range of Cronbach’s Alpha is located between the value of 0.617 to 0.937 which are
categorized as accepted reliability value and very good level of reliability value.
Table 4.1 Reliability for Pilot Test
Variable Construct Cronbach’s Alpha No. Of Item
IV 1 Price History 0.781 4
IV 2 Store Visit History 0.742 3
IV 3 Customer Characteristics 0.936 4
IV 4 Store Environment 0.852 4
IV 5 Product Category 0.617 3
DV Customer Purchase Intention 0.937 4
4.2 PROFILE OF RESPONDENTS
Table 4.2 displays the frequency and percentage of respondents’ demographic. In this study, the
questionnaire consists of 8 questions under demographic profile such as gender, age, ethnicity, monthly
income, type of frozen foods, buying frequency and price range on the last purchase as well as expected
price range in the next future.
In this research, there were 96 (56.50%) female respondents who participated in answering
the questionnaire followed by male with 74 (43.50%) respondents. Next, the majority of the
914