
Page 916 - MARSIUM'21 COMP OF PAPER
P. 916
917 Tan Yi Ting & Dr Adaviah (2022)
Reliability tests can ensure the item for each variable has a consistent scale of measurement. In this
study, reliability of the independent variables and dependent variable will be measured through
Cronbach’s Alpha. If the value of Cronbach’s Alpha is higher, it presented that the variable is higher
reliability. A general accepted rule mentioned in previous study of Ursachi, Horodnic & Zait (2015)
that the reliability values of 0.6 to 0.7 are acceptable and 0.8 and above is a very good level. However,
the value of Cronbach’s alpha at 0.7 or more is considered as an acceptable reliability coefficient
(Nunally, 1978). On the other hand, Keith (2016) suggested that the value of Cronbach’s Alpha within
0.45 to 0.98 was considered acceptable, followed by 0.61 to 0.65 as moderate, 0.67 to
0.87 as reasonable, 0.71 to 0.91 as good, 0.73 to 0.95 as high, 0.84 to 0.90 as reliable and 0.93 to
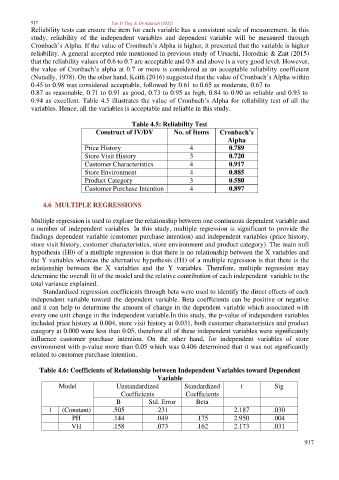
0.94 as excellent. Table 4.5 illustrates the value of Cronbach’s Alpha for reliability test of all the
variables. Hence, all the variables is acceptable and reliable in this study.
Table 4.5: Reliability Test
Construct of IV/DV No. of Items Cronbach’s
Alpha
Price History 4 0.789
Store Visit History 3 0.720
Customer Characteristics 4 0.917
Store Environment 4 0.885
Product Category 3 0.580
Customer Purchase Intention 4 0.897
4.6 MULTIPLE REGRESSIONS
Multiple regression is used to explore the relationship between one continuous dependent variable and
a number of independent variables. In this study, multiple regression is significant to provide the
findings dependent variable (customer purchase intention) and independent variables (price history,
store visit history, customer characteristics, store environment and product category). The main null
hypothesis (H0) of a multiple regression is that there is no relationship between the X variables and
the Y variables whereas the alternative hypothesis (H1) of a multiple regression is that there is the
relationship between the X variables and the Y variables. Therefore, multiple regression may
determine the overall fit of the model and the relative contribution of each independent variable to the
total variance explained.
Standardized regression coefficients through beta were used to identify the direct effects of each
independent variable toward the dependent variable. Beta coefficients can be positive or negative
and it can help to determine the amount of change in the dependent variable which associated with
every one unit change in the independent variable.In this study, the p-value of independent variables
included price history at 0.004, store visit history at 0.031, both customer characteristics and product
category at 0.000 were less than 0.05, therefore all of these independent variables were significantly
influence customer purchase intention. On the other hand, for independent variables of store
environment with p-value more than 0.05 which was 0.406 determined that it was not significantly
related to customer purchase intention.
Table 4.6: Coefficients of Relationship between Independent Variables toward Dependent
Variable
Model Unstandardized Standardized t Sig
Coefficients Coefficients
B Std. Error Beta
1 (Constant) .505 .231 2.187 .030
PH .144 .049 .175 2.950 .004
VH .158 .073 .162 2.173 .031
917