
Page 928 - MARSIUM'21 COMP OF PAPER
P. 928
929 Kelly & Mazilah (2021)
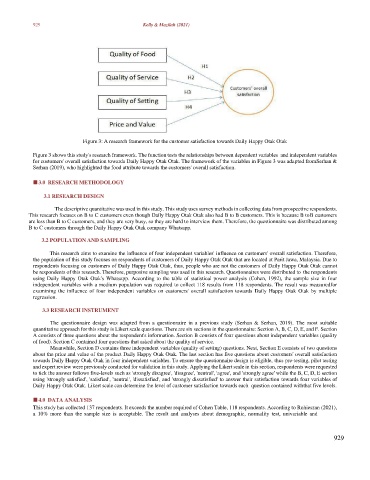
Figure 3: A research framework for the customer satisfaction towards Daily Happy Otak Otak
Figure 3 shows this study's research framework. The function tests the relationships between dependent variables and independent variables
for customers' overall satisfaction towards Daily Happy Otak Otak. The framework of the variables in Figure 3 was adapted from Serhan &
Serhan (2019), who highlighted the food attribute towards the customers' overall satisfaction.
■ 3.0 RESEARCH METHODOLOGY
3.1 RESEARCH DESIGN
The descriptive quantitative was used in this study. This study uses survey methods in collecting data from prospective respondents.
This research focuses on B to C customers even though Daily Happy Otak Otak also had B to B customers. This is because B to B customers
are less than B to C customers, and they are very busy, so they are hard to interview them. Therefore, the questionnaire was distributed among
B to C customers through the Daily Happy Otak Otak company Whatsapp.
3.2 POPULATION AND SAMPLING
This research aims to examine the influence of four independent variables' influence on customers' overall satisfaction. Therefore,
the population of this study focuses on respondents of customers of Daily Happy Otak Otak that are located at Parit Jawa, Malaysia. Due to
respondents focusing on customers of Daily Happy Otak Otak, thus, people who are not the customers of Daily Happy Otak Otak cannot
be respondents of this research. Therefore, purposive sampling was used in this research. Questionnaires were distributed to the respondents
using Daily Happy Otak Otak's Whatsapp. According to the table of statistical power analysis (Cohen, 1992), the sample size in four
independent variables with a medium population was required to collect 118 results from 118 respondents. The result was measured for
examining the influence of four independent variables on customers' overall satisfaction towards Daily Happy Otak Otak by multiple
regression.
3.3 RESEARCH INSTRUMENT
The questionnaire design was adapted from a questionnaire in a previous study (Serhan & Serhan, 2019). The most suitable
quantitative approach for this study is Likert scale questions. There are six sections in the questionnaire: Section A, B, C, D, E, and F. Section
A consists of three questions about the respondent's information. Section B consists of four questions about independent variables (quality
of food). Section C contained four questions that asked about the quality of service.
Meanwhile, Section D contains three independent variables (quality of setting) questions. Next, Section E consists of two questions
about the price and value of the product Daily Happy Otak Otak. The last section has five questions about customers' overall satisfaction
towards Daily Happy Otak Otak in four independent variables. To ensure the questionnaire design is eligible, thus pre-testing, pilot testing
and expert review were previously conducted for validation in this study. Applying the Likert scale in this section, respondents were requested
to tick the answer follows five-levels such as 'strongly disagree', 'disagree', 'neutral', 'agree', and 'strongly agree' while the B, C, D, E section
using 'strongly satisfied', 'satisfied', 'neutral', 'dissatisfied', and 'strongly dissatisfied' to answer their satisfaction towards four variables of
Daily Happy Otak Otak. Likert scale can determine the level of customer satisfaction towards each question contained with that five levels.
■ 4.0 DATA ANALYSIS
This study has collected 137 respondents. It exceeds the number required of Cohen Table, 118 respondents. According to Rohieszan (2021),
a 10% more than the sample size is acceptable. The result and analyses about demographic, normality test, univariable and
929