Page 929 - MARSIUM'21 COMP OF PAPER
P. 929

930                                 Kelly & Mazilah (2021)
            multivariable analysis, multicollinearity analysis, and multiple regression analysis were stated in this chapter. Besides, the reliability test was
            used in a pilot study that collected 30 respondents.

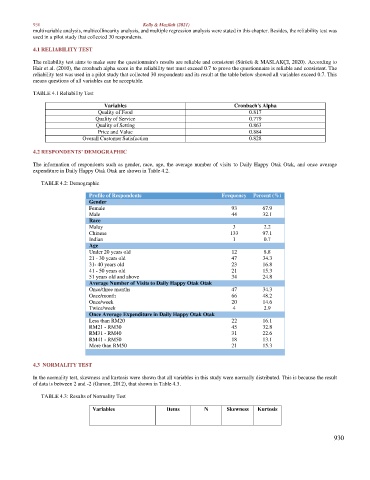
            4.1 RELIABILITY TEST

            The reliability test aims to make sure the questionnaire's results are reliable and consistent (Sürücü & MASLAKÇI, 2020). According to
            Hair et al. (2010), the cronbach alpha score in the reliability test must exceed 0.7 to prove the questionnaire is reliable and consistent. The
            reliability test was used in a pilot study that collected 30 respondents and its result at the table below showed all variables exceed 0.7. This
            means questions of all variables can be acceptable.

            TABLE 4.1 Reliability Test

                                   Variables                                  Cronbach's Alpha
                                 Quality of Food                                   0.817
                                 Quality of Service                                0.779
                                 Quality of Setting                                0.863
                                 Price and Value                                   0.884
                            Overall Customer Satisfaction                          0.828

            4.2 RESPONDENTS’ DEMOGRAPHIC

            The information of respondents such as gender, race, age, the average number of visits to Daily Happy Otak Otak, and once average
            expenditure in Daily Happy Otak Otak are shown in Table 4.2.

               TABLE 4.2: Demographic

                               Profile of Respondents                     Frequency  Percent (%)
                               Gender
                               Female                                         93        67.9
                               Male                                           44        32.1
                               Race
                               Malay                                          3         2.2
                               Chinese                                       133        97.1
                               Indian                                         1         0.7
                               Age
                               Under 20 years old                             12        8.8
                               21 - 30 years old                              47        34.3
                               31- 40 years old                               23        16.8
                               41 - 50 years old                              21        15.3
                               51 years old and above                         34        24.8
                               Average Number of Visits to Daily Happy Otak Otak
                               Once/three months                              47        34.3
                               Once/month                                     66        48.2
                               Once/week                                      20        14.6
                               Twice/week                                     4         2.9
                               Once Average Expenditure in Daily Happy Otak Otak
                               Less than RM20                                 22        16.1
                               RM21 - RM30                                    45        32.8
                               RM31 - RM40                                    31        22.6
                               RM41 - RM50                                    18        13.1
                               More than RM50                                 21        15.3


            4.3  NORMALITY TEST

            In the normality test, skewness and kurtosis were shown that all variables in this study were normally distributed. This is because the result
            of data is between 2 and -2 (Garson, 2012), that shown in Table 4.3.

               TABLE 4.3: Results of Normality Test

                                Variables               Items        N      Skewness   Kurtosis


                                                                                                                930
   924   925   926   927   928   929   930   931   932   933   934