
Page 930 - MARSIUM'21 COMP OF PAPER
P. 930
931 Kelly & Mazilah (2021)
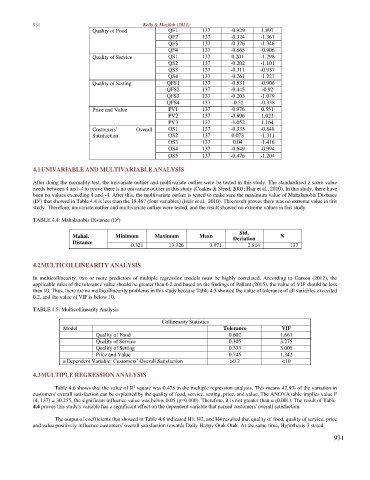
Quality of Food QF1 137 -0.929 1.897
QF2 137 -0.324 -1.361
QF3 137 -0.376 -1.346
QF4 137 -0.665 -0.906
Quality of Service QS1 137 0.201 -1.298
QS2 137 -0.202 -1.101
QS3 137 -0.311 -0.937
QS4 137 -0.261 -1.227
Quality of Setting QFS1 137 -0.531 -0.906
QFS2 137 -0.445 -0.92
QFS3 137 -0.203 -1.079
QFS4 137 -0.52 -0.338
Price and Value PV1 137 -0.976 0.551
PV2 137 -0.896 1.023
PV3 137 -1.052 1.164
Customers’ Overall OS1 137 -0.335 -0.848
Satisfaction OS2 137 0.073 -1.311
OS3 137 0.04 -1.416
OS4 137 -0.649 -0.994
OS5 137 -0.476 -1.204
4.1 UNIVARIABLE AND MULTIVARIABLE ANALYSIS
After doing the normality test, the univariate outlier and multivariate outlier were be tested in this study. The standardised z score value
needs between 4 and -4 to prove there is no univariate outlier in this study (Coakes & Steed, 2003; Hair et al., 2010). In this study, there have
been no values exceeding 4 and -4. After this, the multivariate outlier is tested to make sure the maximum value of Mahalanobis Distance
(D ) that showed in Table 4.4 is less than the 18.467 (four variables) (Hair et al., 2010). This result proves there was no extreme value in this
2
study. Therefore, univariate outlier and multivariate outlier were tested, and the result showed no extreme values in this study.
TABLE 4.4: Mahalanobis Distance (D )
2
Std.
Mahal. Minimum Maximum Mean Deviation N
Distance 0.321 13.326 3.971 2.814 137
4.2 MULTICOLLINEARITY ANALYSIS
In multicollinearity, two or more predictors of multiple regression models must be highly correlated. According to Garson (2012), the
applicable rules of the tolerance value should be greater than 0.2 and based on the findings of Pallant (2015), the value of VIF should be less
than 10. Thus, there are no multicollinearity problems in this study because Table 4.5 showed the value of tolerance of all variables exceeded
0.2, and the value of VIF is below 10.
TABLE 4.5: Multicollinearity Analysis
Collinearity Statistics
Model Tolerance VIF
Quality of Food 0.602 1.661
Quality of Service 0.305 3.275
Quality of Setting 0.333 3.005
Price and Value 0.745 1.342
a Dependent Variable: Customers’ Overall Satisfaction >0.2 <10
4.3 MULTIPLE REGRESSION ANALYSIS
2
Table 4.6 shows that the value of R square was 0.478 in the multiple regression analysis. This means 47.8% of the variation in
customers' overall satisfaction can be explained by the quality of food, service, setting, price, and value. The ANOVA table implies value F
(4, 137) = 30.255, the significant influence value was below 0.05 (ρ=0.000). Therefore, it is not greater than α (0.001). The result of Table
4.4 proves this study's variable has a significant effect on the dependent variable that named customers' overall satisfaction.
The output of coefficients that showed in Table 4.8 indicated H1, H2, and H4 resulted that quality of food, quality of service, price
and value positively influence customers' overall satisfaction towards Daily Happy Otak Otak. At the same time, Hypothesis 3 stated
931