
Page 18 - Math 7
P. 18
Set
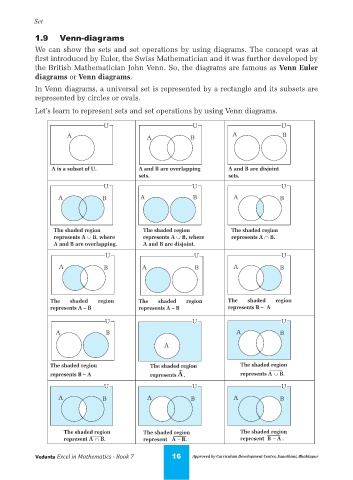
1.9 Venn-diagrams
We can show the sets and set operations by using diagrams. The concept was at
first introduced by Euler, the Swiss Mathematician and it was further developed by
the British Mathematician John Venn. So, the diagrams are famous as Venn Euler
diagrams or Venn diagrams.
In Venn diagrams, a universal set is represented by a rectangle and its subsets are
represented by circles or ovals.
Let’s learn to represent sets and set operations by using Venn diagrams.
U U U
A A B A B
U U U
A B A B A B
U U U
A B A B A B
The shaded region The shaded region The shaded region
represents A – B represents A – B represents B – A
U U U
A B A B
A
A A B
U U U
A B A B A B
The shaded region The shaded region The shaded region
represent A B. represent A – B. represent B – A .
Vedanta Excel in Mathematics - Book 7 16 Approved by Curriculum Development Centre, Sanothimi, Bhaktapur