
Page 33 - The Atlas of Economic Complexity
P. 33
34 | THE ATLAS OF ECONOMIC COMPLEXITY
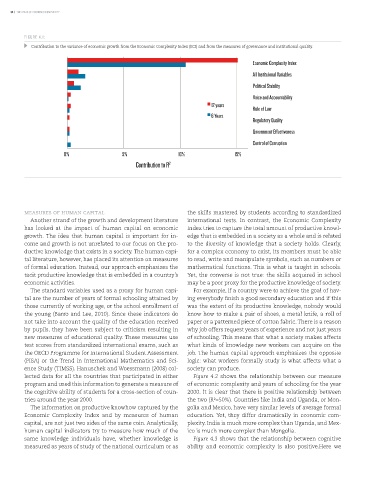
FIGURE 4.1:
Contribution to the variance of economic growth from the Economic Complexity Index (ECI) and from the measures of governance and institutional quality.
Economic Complexity Index
All Instituional Variables
Political Stability
Voice and Accountability
12 years
Rule of Law
6 Years
Regulatory Quality
Government Effectiveness
Control of Corruption
0% 5% 10% 15%
Contribution to R 2
measures of human capital the skills mastered by students according to standardized
Another strand of the growth and development literature international tests. In contrast, the Economic Complexity
has looked at the impact of human capital on economic Index tries to capture the total amount of productive knowl-
growth. The idea that human capital is important for in- edge that is embedded in a society as a whole and is related
come and growth is not unrelated to our focus on the pro- to the diversity of knowledge that a society holds. Clearly,
ductive knowledge that exists in a society. The human capi- for a complex economy to exist, its members must be able
tal literature, however, has placed its attention on measures to read, write and manipulate symbols, such as numbers or
of formal education. Instead, our approach emphasizes the mathematical functions. This is what is taught in schools.
tacit productive knowledge that is embedded in a country’s Yet, the converse is not true: the skills acquired in school
economic activities. may be a poor proxy for the productive knowledge of society.
The standard variables used as a proxy for human capi- For example, if a country were to achieve the goal of hav-
tal are the number of years of formal schooling attained by ing everybody finish a good secondary education and if this
those currently of working age, or the school enrollment of was the extent of its productive knowledge, nobody would
the young (Barro and Lee, 2010). Since these indicators do know how to make a pair of shoes, a metal knife, a roll of
not take into account the quality of the education received paper or a patterned piece of cotton fabric. There is a reason
by pupils, they have been subject to criticism resulting in why job offers request years of experience and not just years
new measures of educational quality. These measures use of schooling. This means that what a society makes affects
test scores from standardized international exams, such as what kinds of knowledge new workers can acquire on the
the OECD Programme for International Student Assessment job. The human capital approach emphasizes the opposite
(PISA) or the Trend in International Mathematics and Sci- logic: what workers formally study is what affects what a
ence Study (TIMSS). Hanuschek and Woessmann (2008) col- society can produce.
lected data for all the countries that participated in either Figure 4.2 shows the relationship between our measure
program and used this information to generate a measure of of economic complexity and years of schooling for the year
the cognitive ability of students for a cross-section of coun- 2000. It is clear that there is positive relationship between
tries around the year 2000. the two (R =50%). Countries like India and Uganda, or Mon-
2
The information on productive knowhow captured by the golia and Mexico, have very similar levels of average formal
Economic Complexity Index and by measures of human education. Yet, they differ dramatically in economic com-
capital, are not just two sides of the same coin. Analytically, plexity. India is much more complex than Uganda, and Mex-
human capital indicators try to measure how much of the ico is much more complex than Mongolia.
same knowledge individuals have, whether knowledge is Figure 4.3 shows that the relationship between cognitive
measured as years of study of the national curriculum or as ability and economic complexity is also positive.Here we