
Page 34 - The Atlas of Economic Complexity
P. 34
MAPPING PATHS TO PROSPERITY | 35
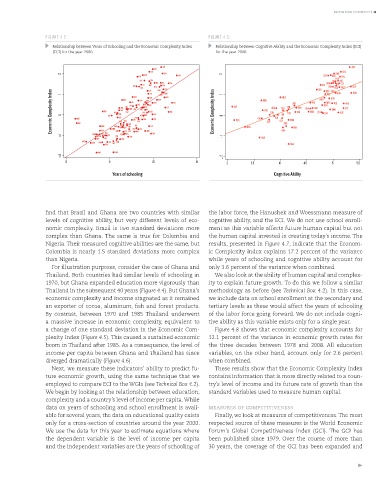
FIGURE 4.2: FIGURE 4.3:
Relationship between Years of Schooling and the Economic Complexity Index Relationship between Cognitive Ability and the Economic Complexity Index (ECI)
(ECI) for the year 2000. for the year 2000.
JPN JPN
DEU
CHE CHE
2 GBR SWE USA 2 USA GBR SWE
FIN FRA FIN
AUT FRA IRL AUT
BEL IRL CZE DNK BEL CZE
ITA DNK ITA
SGP NLD SVK SVN NLD SGP
SVN ESP POL CAN UKR KOR HUN ISR NOR 1 MEX ISR NOR ESP CAN SVK HUN KOR
Economic Complexity Index 0 MOZ MLI IND IDN VEN TUN EGY PRY QAT COL SAU GAB ZAF PRT ARE PHL JOR HRV ARG LVA MYS PAN GRC HKG BGR LTU ROU EST AUS NZL Economic Complexity Index 0 ZAF PER PHL BRA SAU ALB TUN IDN EGY LBN ZWE TUR MKD JOR IND URY THA MDA PRT GRC LTU BGR MYS CHN NZL AUS EST
POL
1
MEX
RUS
RUS
BRA
HKG
CHL COL
THA
ARG
CHN URY
CHL
TUR
LVA
KAZ
KGZ TTO
ALB
PER
IRN LBY
ECU
−1 LBR MRT SEN GTM PAK MAR BGD SYR VNM KWT ZMB DZA KEN SLV MUS ZWE GHA LKA CRI MNG BOL JAM TJK CUB 1 MAR GHA KWT IRN
COG
CIV LAO HND -
YEM SDN PNG TZA NIC KHM
UGA NGA
MWI CMR
−2 2
_
0 5 10 15 3 3.5 4 4.5 5 5.5
Years of schooling Cognitive Ability
find that Brazil and Ghana are two countries with similar the labor force, the Hanushek and Woessmann measure of
levels of cognitive ability, but very different levels of eco- cognitive ability, and the ECI. We do not use school enroll-
nomic complexity. Brazil is two standard deviations more ment as this variable affects future human capital but not
complex than Ghana. The same is true for Colombia and the human capital invested in creating today’s income. The
Nigeria. Their measured cognitive abilities are the same, but results, presented in Figure 4.7, indicate that the Econom-
Colombia is nearly 1.5 standard deviations more complex ic Complexity Index explains 17.2 percent of the variance
than Nigeria. while years of schooling and cognitive ability account for
For illustration purposes, consider the case of Ghana and only 3.6 percent of the variance when combined.
Thailand. Both countries had similar levels of schooling in We also look at the ability of human capital and complex-
1970, but Ghana expanded education more vigorously than ity to explain future growth. To do this we follow a similar
Thailand in the subsequent 40 years (Figure 4.4). But Ghana’s methodology as before (see Technical Box 4.2). In this case,
economic complexity and income stagnated as it remained we include data on school enrollment at the secondary and
an exporter of cocoa, aluminum, fish and forest products. tertiary levels as these would affect the years of schooling
By contrast, between 1970 and 1985 Thailand underwent of the labor force going forward. We do not include cogni-
a massive increase in economic complexity, equivalent to tive ability as this variable exists only for a single year.
a change of one standard deviation in the Economic Com- Figure 4.8 shows that economic complexity accounts for
plexity Index (Figure 4.5). This caused a sustained economic 12.1 percent of the variance in economic growth rates for
boom in Thailand after 1985. As a consequence, the level of the three decades between 1978 and 2008. All education
income per capita between Ghana and Thailand has since variables, on the other hand, account only for 2.6 percent
diverged dramatically (Figure 4.6). when combined.
Next, we measure these indicators’ ability to predict fu- These results show that the Economic Complexity Index
ture economic growth, using the same technique that we contains information that is more directly related to a coun-
employed to compare ECI to the WGIs (see Technical Box 4.2). try’s level of income and its future rate of growth than the
We begin by looking at the relationship between education, standard variables used to measure human capital.
complexity and a country’s level of income per capita. While
data on years of schooling and school enrollment is avail- measures of competitiveness
able for several years, the data on educational quality exists Finally, we look at measures of competitiveness. The most
only for a cross-section of countries around the year 2000. respected source of these measures is the World Economic
We use the data for this year to estimate equations where Forum’s Global Competitiveness Index (GCI). The GCI has
the dependent variable is the level of income per capita been published since 1979. Over the course of more than
and the independent variables are the years of schooling of 30 years, the coverage of the GCI has been expanded and