
Page 44 - The Atlas of Economic Complexity
P. 44
MAPPING PATHS TO PROSPERITY | 45
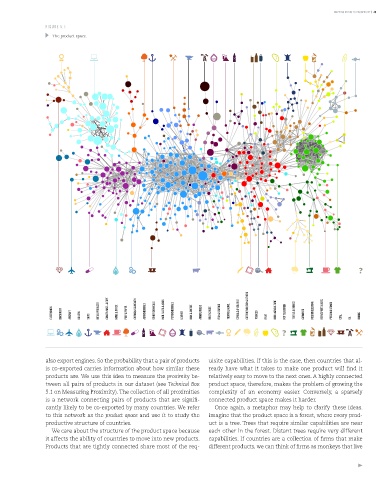
FIGURE 5.1:
The product space.
ELECTRONICS MACHINERY AIRCRAFT bOILERS SHIPS METAL PRODUCTS CONSTR. MATL. & EqPT. HOME & OFFICE PULP & PAPER CHEMICALS & HEALTH AGROCHEMICALS OTHER CHEMICALS INOR. SALTS & ACIDS PETROCHEMICALS LEATHER MILK & CHEESE ANIMAL FIbERS MEAT & EGGS FISH & SEAFOOD TROPICAL AGRIC. CEREALS & vEG. OILS COTTON/RICE/SOY & OTHERS TObACCO FRUIT MISC. AGRICULTURE NOT CLASSIFIED TEXTILE & FAbRICS GARMENTS FOOD PROCESSING bEER/SPIRITS & CIGS. PRECIOUS STONES COAL OIL MINING
also export engines. So the probability that a pair of products uisite capabilities. If this is the case, then countries that al-
is co-exported carries information about how similar these ready have what it takes to make one product will find it
products are. We use this idea to measure the proximity be- relatively easy to move to the next ones. A highly connected
tween all pairs of products in our dataset (see Technical Box product space, therefore, makes the problem of growing the
5.1 on Measuring Proximity). The collection of all proximities complexity of an economy easier. Conversely, a sparsely
is a network connecting pairs of products that are signifi- connected product space makes it harder.
cantly likely to be co-exported by many countries. We refer Once again, a metaphor may help to clarify these ideas.
to this network as the product space and use it to study the Imagine that the product space is a forest, where every prod-
productive structure of countries. uct is a tree. Trees that require similar capabilities are near
We care about the structure of the product space because each other in the forest. Distant trees require very different
it affects the ability of countries to move into new products. capabilities. If countries are a collection of firms that make
Products that are tightly connected share most of the req- different products, we can think of firms as monkeys that live