
Page 45 - The Atlas of Economic Complexity
P. 45
46 | THE ATLAS OF ECONOMIC COMPLEXITY
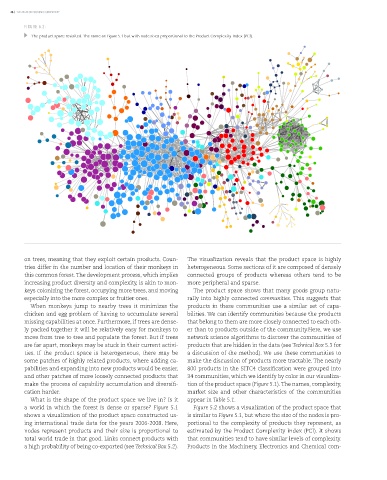
FIGURE 5.2:
The product space revisited. The same as Figure 5.1 but with node sizes proportional to the Product Complexity Index (PCI).
on trees, meaning that they exploit certain products. Coun- The visualization reveals that the product space is highly
tries differ in the number and location of their monkeys in heterogeneous. Some sections of it are composed of densely
this common forest. The development process, which implies connected groups of products whereas others tend to be
increasing product diversity and complexity, is akin to mon- more peripheral and sparse.
keys colonizing the forest, occupying more trees, and moving The product space shows that many goods group natu-
especially into the more complex or fruitier ones. rally into highly connected communities. This suggests that
When monkeys jump to nearby trees it minimizes the products in these communities use a similar set of capa-
chicken and egg problem of having to accumulate several bilities. We can identify communities because the products
missing capabilities at once. Furthermore, if trees are dense- that belong to them are more closely connected to each oth-
ly packed together it will be relatively easy for monkeys to er than to products outside of the community.Here, we use
move from tree to tree and populate the forest. But if trees network science algorithms to discover the communities of
are far apart, monkeys may be stuck in their current activi- products that are hidden in the data (see Technical Box 5.3 for
ties. If the product space is heterogeneous, there may be a discussion of the method). We use these communities to
some patches of highly related products, where adding ca- make the discussion of products more tractable. The nearly
pabilities and expanding into new products would be easier, 800 products in the SITC4 classification were grouped into
and other patches of more loosely connected products that 34 communities, which we identify by color in our visualiza-
make the process of capability accumulation and diversifi- tion of the product space (Figure 5.1). The names, complexity,
cation harder. market size and other characteristics of the communities
What is the shape of the product space we live in? Is it appear in Table 5.1.
a world in which the forest is dense or sparse? Figure 5.1 Figure 5.2 shows a visualization of the product space that
shows a visualization of the product space constructed us- is similar to Figure 5.1, but where the size of the nodes is pro-
ing international trade data for the years 2006-2008. Here, portional to the complexity of products they represent, as
nodes represent products and their size is proportional to estimated by the Product Complexity Index (PCI). It shows
total world trade in that good. Links connect products with that communities tend to have similar levels of complexity.
a high probability of being co-exported (see Technical Box 5.2). Products in the Machinery, Electronics and Chemical com-