
Page 46 - The Atlas of Economic Complexity
P. 46
MAPPING PATHS TO PROSPERITY | 47
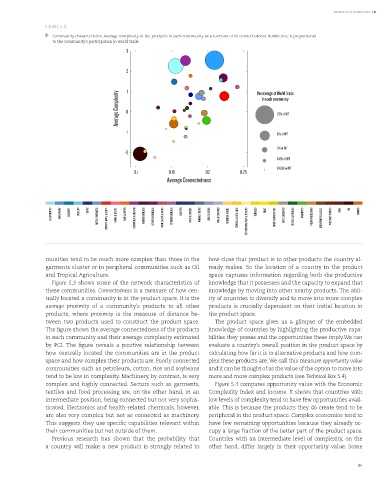
FIGURE 5.3:
Community characteristics. Average complexity of the products in each community as a function of its connectedness. Bubble size is proportional
to the community’s participation in world trade.
3
2
Average Complexity 0 1 Percentage of World Trade
in each community
22% of WT
-1 6% of WT
2% of WT
-2
0.8% of WT
0.06% of WT
0.1 0.15 0.2 0.25
Average Connectedness
ELECTRONICS MACHINERY AIRCRAFT bOILERS SHIPS METAL PRODUCTS CONSTR. MATL. & EqPT. HOME & OFFICE PULP & PAPER CHEMICALS & HEALTH AGROCHEMICALS OTHER CHEMICALS INOR. SALTS & ACIDS PETROCHEMICALS LEATHER MILK & CHEESE ANIMAL FIbERS MEAT & EGGS FISH & SEAFOOD TROPICAL AGRIC. CEREALS & vEG. OILS COTTON/RICE/SOY & OTHERS TObACCO FRUIT MISC. AGRICULTURE NOT CLASSIFIED TEXTILE & FAbRICS GARMENTS FOOD PROCESSING bEER/SPIRITS & CIGS. PRECIOUS STONES COAL OIL MINING
munities tend to be much more complex than those in the how close that product is to other products the country al-
garments cluster or in peripheral communities such as Oil ready makes. So the location of a country in the product
and Tropical Agriculture. space captures information regarding both the productive
Figure 5.3 shows some of the network characteristics of knowledge that it possesses and the capacity to expand that
these communities. Connectedness is a measure of how cen- knowledge by moving into other nearby products. The abil-
trally located a community is in the product space. It is the ity of countries to diversify and to move into more complex
average proximity of a community’s products to all other products is crucially dependent on their initial location in
products, where proximity is the measure of distance be- the product space.
tween two products used to construct the product space. The product space gives us a glimpse of the embedded
The figure shows the average connectedness of the products knowledge of countries by highlighting the productive capa-
in each community and their average complexity estimated bilities they posses and the opportunities these imply.We can
by PCI. The figure reveals a positive relationship between evaluate a country’s overall position in the product space by
how centrally located the communities are in the product calculating how far it is to alternative products and how com-
space and how complex their products are. Poorly connected plex these products are. We call this measure opportunity value
communities such as petroleum, cotton, rice and soybeans and it can be thought of as the value of the option to move into
tend to be low in complexity. Machinery, by contrast, is very more and more complex products (see Technical Box 5.4).
complex and highly connected. Sectors such as garments, Figure 5.4 compares opportunity value with the Economic
textiles and food processing are, on the other hand, in an Complexity Index and income. It shows that countries with
intermediate position, being connected but not very sophis- low levels of complexity tend to have few opportunities avail-
ticated. Electronics and health-related chemicals, however, able. This is because the products they do create tend to be
are also very complex but not as connected as machinery. peripheral in the product space. Complex economies tend to
This suggests they use specific capabilities relevant within have few remaining opportunities because they already oc-
their communities but not outside of them. cupy a large fraction of the better part of the product space.
Previous research has shown that the probability that Countries with an intermediate level of complexity, on the
a country will make a new product is strongly related to other hand, differ largely in their opportunity value. Some