Page 40 - The Atlas of Economic Complexity
P. 40

MAPPING PATHS TO PROSPERITY  |  41
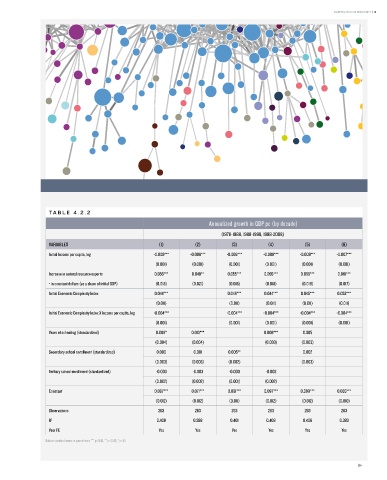


                   TA B L E   4 . 2 . 2
                                                                               Annualized growth in GDP pc (by decade)

                                                                                   (1978-1988, 1988-1998, 1998-2008)
                   VARIABLES                                (1)           (2)          (3)           (4)          (5)           (6)
                   Initial Income per capita, log         -0.009***     -0.006***    -0.008***     -0.009***     -0.009***    -0.007***

                                                           (0.001)      (0.001)       (0.001)       (0.001)      (0.001)       (0.001)
                   Increase in natural resource exports    0.055***     0.049**       0.055***     0.055***      0.055***      0.061***
                   - in constant dollars (as a share of initial GDP)  (0.018)  (0.021)  (0.018)     (0.018)      (0.018)       (0.017)

                   Initial Economic Complexity Index       0.044***                   0.046***     0.044***      0.045***      0.052***
                                                           (0.011)                    (0.011)       (0.011)       (0.011)      (0.011)
                   Initial Economic Complexity Index X Income per capita, log  -0.004***  -0.004***  -0.004***   -0.004***    -0.004***
                                                           (0.001)                    (0.001)       (0.001)      (0.001)       (0.001)

                   Years of schooling (standardized)       0.008*       0.013***                   0.008***       0.005
                                                           (0.004)      (0.004)                     (0.003)      (0.003)
                   Secondary school enrollment (standardized)  0.000     0.001        0.005**                     0.002

                                                           (0.003)      (0.003)       (0.002)                    (0.003)
                   Tertiary school enrollment (standardized)  -0.003     -0.003       -0.000        -0.003
                                                           (0.002)      (0.002)       (0.001)       (0.002)
                   Constant                                0.097***     0.071***      0.091***     0.097***      0.099***      0.083***

                                                           (0.012)       (0.012)      (0.011)       (0.012)      (0.012)       (0.010)
                   Observations                             263           263          263           263          263           263
                   R 2                                     0.409         0.288         0.401        0.409         0.406        0.383
                   Year FE                                  Yes           Yes          Yes           Yes           Yes          Yes

                  Robust standard errors in parentheses *** p<0.01, ** p<0.05, * p<0.1
   35   36   37   38   39   40   41   42   43   44   45