
Page 21 - MODULE QUALITY TOOLS DMQ 30262
P. 21
DMQ 30262
2.4 HISTOGRAMS
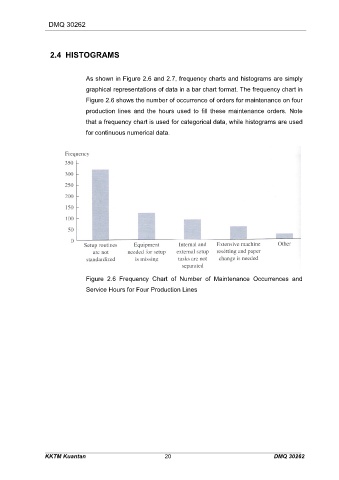
As shown in Figure 2.6 and 2.7, frequency charts and histograms are simply
graphical representations of data in a bar chart format. The frequency chart in
Figure 2.6 shows the number of occurrence of orders for maintenance on four
production lines and the hours used to fill these maintenance orders. Note
that a frequency chart is used for categorical data, while histograms are used
for continuous numerical data.
Figure 2.6 Frequency Chart of Number of Maintenance Occurrences and
Service Hours for Four Production Lines
KKTM Kuantan 20 DMQ 30262