
Page 26 - MODULE QUALITY TOOLS DMQ 30262
P. 26
DMQ 30262
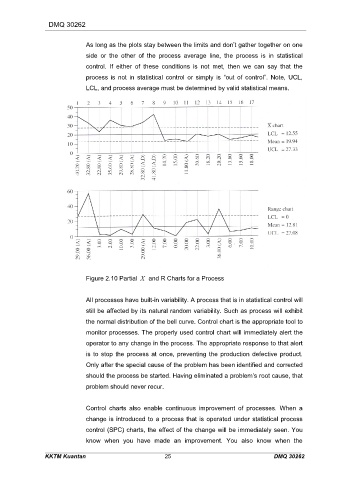
As long as the plots stay between the limits and don’t gather together on one
side or the other of the process average line, the process is in statistical
control. If either of these conditions is not met, then we can say that the
process is not in statistical control or simply is “out of control”. Note, UCL,
LCL, and process average must be determined by valid statistical means.
Figure 2.10 Partial X and R Charts for a Process
All processes have built-in variability. A process that is in statistical control will
still be affected by its natural random variability. Such as process will exhibit
the normal distribution of the bell curve. Control chart is the appropriate tool to
monitor processes. The properly used control chart will immediately alert the
operator to any change in the process. The appropriate response to that alert
is to stop the process at once, preventing the production defective product.
Only after the special cause of the problem has been identified and corrected
should the process be started. Having eliminated a problem’s root cause, that
problem should never recur.
Control charts also enable continuous improvement of processes. When a
change is introduced to a process that is operated under statistical process
control (SPC) charts, the effect of the change will be immediately seen. You
know when you have made an improvement. You also know when the
KKTM Kuantan 25 DMQ 30262