
Page 25 - MODULE QUALITY TOOLS DMQ 30262
P. 25
DMQ 30262
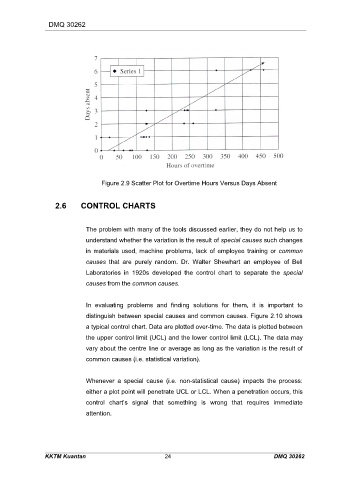
Figure 2.9 Scatter Plot for Overtime Hours Versus Days Absent
2.6 CONTROL CHARTS
The problem with many of the tools discussed earlier, they do not help us to
understand whether the variation is the result of special causes such changes
in materials used, machine problems, lack of employee training or common
causes that are purely random. Dr. Walter Shewhart an employee of Bell
Laboratories in 1920s developed the control chart to separate the special
causes from the common causes.
In evaluating problems and finding solutions for them, it is important to
distinguish between special causes and common causes. Figure 2.10 shows
a typical control chart. Data are plotted over-time. The data is plotted between
the upper control limit (UCL) and the lower control limit (LCL). The data may
vary about the centre line or average as long as the variation is the result of
common causes (i.e. statistical variation).
Whenever a special cause (i.e. non-statistical cause) impacts the process:
either a plot point will penetrate UCL or LCL. When a penetration occurs, this
control chart’s signal that something is wrong that requires immediate
attention.
KKTM Kuantan 24 DMQ 30262