
Page 80 - MODULE QUALITY TOOLS DMQ 30262
P. 80
DMQ 30262
to the product or service. A CTQ usually must be interpreted from a qualitative customer
statement to an actionable, quantitative business specification
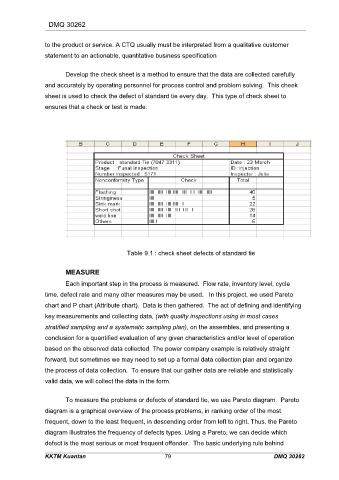
Develop the check sheet is a method to ensure that the data are collected carefully
and accurately by operating personnel for process control and problem solving. This cheek
sheet is used to check the defect of standard tie every day. This type of check sheet to
ensures that a check or test is made.
Table 9.1 : check sheet defects of standard tie
MEASURE
Each important step in the process is measured. Flow rate, inventory level, cycle
time, defect rate and many other measures may be used. In this project, we used Pareto
chart and P chart (Attribute chart). Data is then gathered. The act of defining and identifying
key measurements and collecting data, (with quality inspections using in most cases
stratified sampling and a systematic sampling plan), on the assembles, and presenting a
conclusion for a quantified evaluation of any given characteristics and/or level of operation
based on the observed data collected. The power company example is relatively straight
forward, but sometimes we may need to set up a formal data collection plan and organize
the process of data collection. To ensure that our gather data are reliable and statistically
valid data, we will collect the data in the form.
To measure the problems or defects of standard tie, we use Pareto diagram. Pareto
diagram is a graphical overview of the process problems, in ranking order of the most
frequent, down to the least frequent, in descending order from left to right. Thus, the Pareto
diagram illustrates the frequency of defects types. Using a Pareto, we can decide which
defect is the most serious or most frequent offender. The basic underlying rule behind
KKTM Kuantan 79 DMQ 30262