
Page 82 - MODULE QUALITY TOOLS DMQ 30262
P. 82
DMQ 30262
ANALYSIS
In analyze phase, we identify the key relationships to throughput. The action where a
processes, procedure, or service, details are examined for process improvement
opportunities. Note that data is examined and confirmed to demonstrate suspected root or
common causes, (Not Special Cause), and verify a problem statement and the process
analysis should include reviewing process maps for wasted and non-wasted actions
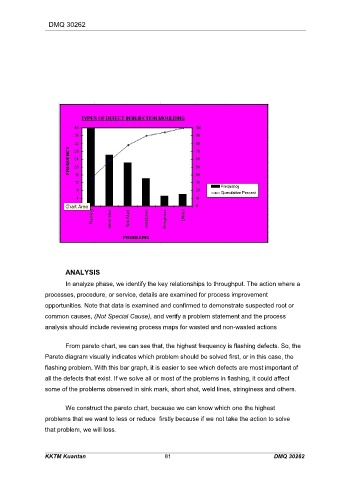
From pareto chart, we can see that, the highest frequency is flashing defects. So, the
Pareto diagram visually indicates which problem should be solved first, or in this case, the
flashing problem. With this bar graph, it is easier to see which defects are most important of
all the defects that exist. If we solve all or most of the problems in flashing, it could affect
some of the problems observed in sink mark, short shot, weld lines, stringiness and others.
We construct the pareto chart, because we can know which one the highest
problems that we want to less or reduce firstly because if we not take the action to solve
that problem, we will loss.
KKTM Kuantan 81 DMQ 30262