
Page 104 - analysis-and-interpretation-of-astronomical-sp
P. 104
Analysis and Interpretation of Astronomical Spectra 104
22.12 Determination of the Excitation Class
Since the beginning of the 20th Century numerous methods have been proposed to deter-
mine the excitation classes of emission nebulae. The 12-level “revised” Gurzadyan system
[10], which has been developed also by, Aller, Webster, Acker and others, is one of the cur-
rently best accepted and appropriate also for amateurs. It relies on the simple principle that
with increasing excitation class, the intensity of the forbidden [O III] lines becomes
stronger, compared with the H-Balmer series. Therefore as a classification criterion the in-
tensity sum of the two brightest [O III] lines, relative to the Hβ emission, is used. Within the
range of the low excitation classes E: 1–4, this value increases strikingly. The [O III] lines at
λλ4959 and 5007 are denoted in the formulas as and .
For low excitation classes E1 – E4:
Within the transition class E4 the He II line at λ 4686 appears for the first time [225]. It re-
quires 24.6 eV for the ionisation. That's almost twice the energy as needed for H II with
13.6 eV. From here on, the intensity of He II increases continuously and replaces the now
stagnant Hβ emission as a comparison value in the formula. The ratio is expressed here
logarithmically (base 10) in order to limit the range of values for the classification system:
For middle and high Excitation Classes E4 – E12:
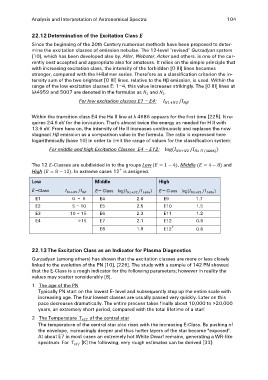
The 12 -Classes are subdivided in to the groups Low ( , Middle and
. In extreme cases 12+ is assigned.
High
Low 0–5 Middle High 1.7
5 – 10 1.5
–Class 10 – 15 – Class – Class 1.2
0.9
E1 >15 E4 2.6 E9
E2 E5 2.5 E10 0.6
E3 E6 2.3 E11
E4 E7 2.1 E12
E8 1.9 E12+
22.13 The Excitation Class as an Indicator for Plasma Diagnostics
Gurzadyan (among others) has shown that the excitation classes are more or less closely
linked to the evolution of the PN [10], [226]. The study with a sample of 142 PN showed
that the E-Class is a rough indicator for the following parameters; however in reality the
values may scatter considerably [8].
1. The age of the PN
Typically PN start on the lowest E- level and subsequently step up the entire scale with
increasing age. The four lowest classes are usually passed very quickly. Later on this
pace decreases dramatically. The entire process takes finally about 10,000 to >20,000
years, an extremely short period, compared with the total lifetime of a star!
2 The Temperature of the central star
The temperature of the central star also rises with the increasing E-Class. By pushing of
the envelope, increasingly deeper and thus hotter layers of the star become "exposed".
At about E7 in most cases an extremely hot White Dwarf remains, generating a WR-like
spectrum. For [K] the following, very rough estimates can be derived [33]: