
Page 16 - analysis-and-interpretation-of-astronomical-sp
P. 16
Analysis and Interpretation of Astronomical Spectra 16
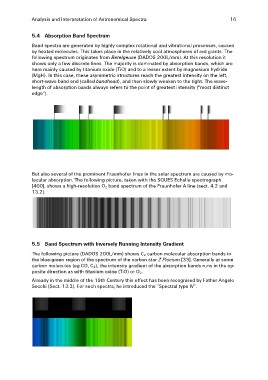
5.4 Absorption Band Spectrum
Band spectra are generated by highly complex rotational and vibrational processes, caused
by heated molecules. This takes place in the relatively cool atmospheres of red giants. The
following spectrum originates from Betelgeuse (DADOS 200L/mm). At this resolution it
shows only a few discrete lines. The majority is dominated by absorption bands, which are
here mainly caused by titanium oxide (TiO) and to a lesser extent by magnesium hydride
(MgH). In this case, these asymmetric structures reach the greatest intensity on the left,
short-wave band end (called bandhead), and then slowly weaken to the right. The wave-
length of absorption bands always refers to the point of greatest intensity ("most distinct
edge").
But also several of the prominent Fraunhofer lines in the solar spectrum are caused by mo-
lecular absorption. The following picture, taken with the SQUES Echelle spectrograph
[400], shows a high-resolution O2 band spectrum of the Fraunhofer A line (sect. 4.2 and
13.2).
5.5 Band Spectrum with Inversely Running Intensity Gradient
The following picture (DADOS 200L/mm) shows C2 carbon molecular absorption bands in
the blue-green region of the spectrum of the carbon star Z Piscium [33]. Generally at some
carbon molecules (eg CO, C2), the intensity gradient of the absorption bands runs in the op-
posite direction as with titanium oxide (TiO) or O2.
Already in the middle of the 19th Century this effect has been recognised by Father Angelo
Secchi (Sect. 13.3). For such spectra, he introduced the “Spectral type IV”.