
Page 29 - analysis-and-interpretation-of-astronomical-sp
P. 29
Analysis and Interpretation of Astronomical Spectra 29
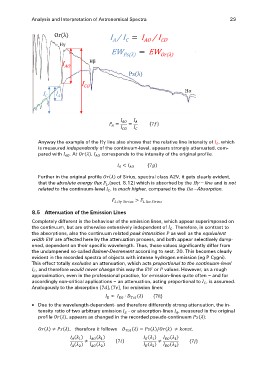
Or(λ) IA / IC = IAO / ICO
EWPs(λ) = EWOr(λ)
Hγ
IAO Hβ
Ps(λ)
ICO Hα
IC IA
Anyway the example of the Hγ line also shows that the relative line intensity of , which
is measured independently of the continuum-level, appears strongly attenuated, com-
pared with . At , corresponds to the intensity of the original profile.
Further in the original profile of Sirius, spectral class A2V, it gets clearly evident,
that the absolute energy flux ,(sect. 8.12) which is absorbed by the Hγ – line and is not
related to the continuum-level , is much higher, compared to the Hα – Absorption.
8.5 Attenuation of the Emission Lines
Completely different is the behaviour of the emission lines, which appear superimposed on
the continuum, but are otherwise extensively independent of . Therefore, in contrast to
the absorptions, also the continuum related peak intensities as well as the equivalent
width are affected here by the attenuation process, and both appear selectively damp-
ened, dependent on their specific wavelength. Thus, these values significantly differ from
the undampened so-called Balmer-Decrement according to sect. 20. This becomes clearly
evident in the recorded spectra of objects with intense hydrogen emission (eg P Cygni).
This effect totally excludes an attenuation, which acts proportional to the continuum-level
, and therefore would never change this way the or values. However, as a rough
approximation, even in the professional practice, for emission-lines quite often – and for
accordingly non-critical applications – an attenuation, acting proportional to , is assumed.
Analogously to the absorption , , for emission lines:
Due to the wavelength-dependent- and therefore differently strong attenuation, the in-
tensity ratio of two arbitrary emission - or absorption-lines , measured in the original
profile , appears as changed in the recorded pseudo-continuum :
, therefore it follows .