
Page 32 - analysis-and-interpretation-of-astronomical-sp
P. 32
Analysis and Interpretation of Astronomical Spectra 32
Like in the recorded pseudo-continuum , also in changes the intensity ratio of
any two emissions or absorptions , measured in the original profile {7i}, {7j}.
The rectified profile, normalised to , enables the determination of the -values
and facilitates the measurement of the , the Doppler-shift , as well as the de-
termination of the spectral class.
By the rectification of the profile, by the information gets lost, which allows, by
means of the known attenuation function , to approximately reconstruct the
original profile (according to formula ).
Anyway, even for most professional applications – with just a few exceptions –, the pro-
file normalisation is clearly the best and easiest option [11].
8.10 Relative Radiometric Flux Calibration by a Synthetic Continuum
The goal of this procedure is a rough approximation of the recorded profile with the
pseudo-continuum , to the original- and therefore not reddened continuum . This
procedure is described in the manual of the Vspec software. With dividing by correction
curves, the spectral lines of the pseudo-continuum are directly transferred to the syn-
thetically produced and fitted continuum course of a virtual model star with the
same spectral class and unreddened by any interstellar dust. Similar to sect. 8.9, this proc-
ess proportionally scales the intensities of all spectral lines from their individual -values in
the pseudo-continuum, up to the level of . For specific applications this procedure
is also applied in the professional field [301].
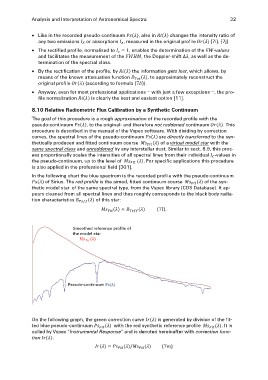
In the following chart the blue spectrum is the recorded profile with the pseudo-continuum
of Sirius. The red profile is the aimed, fitted continuum course of the syn-
thetic model star of the same spectral type, from the Vspec library (CDS Database). It ap-
pears cleaned from all spectral lines and thus roughly corresponds to the black body radia-
tion characteristics of this star:
.
Smoothed reference profile of
the model star
Ms Fit (λ)
Pseudo-continuum Ps(λ)
On the following graph, the green correction curve is generated by division of the fit-
ted blue pseudo-continuum with the red synthetic reference profile . It is
called by Vspec “Instrumental Response” and is denoted hereinafter with correction func-
tion .