
Page 28 - analysis-and-interpretation-of-astronomical-sp
P. 28
Analysis and Interpretation of Astronomical Spectra 28
8.3 Relationship Between Original-Continuum and Pseudo-Continuum
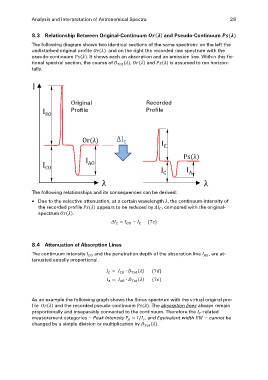
The following diagram shows two identical sections of the same spectrum: on the left the
undisturbed original profile and on the right the recorded raw spectrum with the
pseudo-continuum It shows each an absorption and an emission line. Within this fic-
tional spectral section, the course of , and is assumed to run horizon-
tally.
I Original Recorded
Profile Profile
IEO
Or λ ΔIC IE
ICO IAO Ps λ
IC IA
λλ
The following relationships and its consequences can be derived:
Due to the selective attenuation, at a certain wavelength , the continuum-intensity of
the recorded profile appears to be reduced by , compared with the original-
spectrum .
8.4 Attenuation of Absorption Lines , are at-
The continuum intensity and the penetration depth of the absorption line
tenuated equally proportional.
As an example the following graph shows the Sirius spectrum with the virtual original pro-
file and the recorded pseudo-continuum . The absorption lines always remain
proportionally and inseparably connected to the continuum. Therefore the -related
measurement categories – Peak Intensity , and Equivalent width – cannot be
changed by a simple division or multiplication by .