
Page 33 - analysis-and-interpretation-of-astronomical-sp
P. 33
Analysis and Interpretation of Astronomical Spectra 33
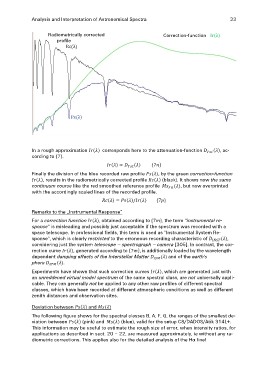
Correction-function Ir(λ)
Radiometrically corrected
profile
Rc(λ)
Ps(λ)
In a rough approximation corresponds here to the attenuation-function , ac-
cording to .
Finally the division of the blue recorded raw profile , by the green correction-function
, results in the radiometrically corrected profile (black). It shows now the same
continuum course like the red smoothed reference profile , but now overprinted
with the accordingly scaled lines of the recorded profile.
Remarks to the „Instrumental Response“
For a correction function , obtained according to , the term "instrumental re-
sponse" is misleading and possibly just acceptable if the spectrum was recorded with a
space telescope. In professional fields, this term is used as "Instrumental System Re-
sponse", which is clearly restricted to the erroneous recording characteristic of ,
considering just the system telescope – spectrograph – camera [305]. In contrast, the cor-
rection curve , generated according to , is additionally loaded by the wavelength
dependent damping effects of the Interstellar Matter and of the earth's
phere .
Experiments have shown that such correction curves , which are generated just with
an unreddened virtual model spectrum of the same spectral class, are not universally appli-
cable. They can generally not be applied to any other raw profiles of different spectral
classes, which have been recorded at different atmospheric conditions as well as different
zenith distances and observation sites.
Deviation between and
The following figure shows for the spectral classes B, A, F, G, the ranges of the smallest de-
viation between (pink) and (blue), valid for the setup C8/DADOS/Atik 314L+.
This information may be useful to estimate the rough size of error, when intensity ratios, for
applications as described in sect. 20 – 22, are measured approximately, ie without any ra-
diometric corrections. This applies also for the detailed analysis of the Hα line!