
Page 43 - analysis-and-interpretation-of-astronomical-sp
P. 43
Analysis and Interpretation of Astronomical Spectra 43
10.3 The Photon Energy of the Balmer Series the
To the wavelengths of the hydrogen lines we can now calculate with formula
corresponding values of the photon energy .
3647 Å n2 – Balmer- 4861 Å n2 – n4 6563 Å n2 – n3 Electron
Edge transition
Wavelength [Å]
3889 Å n2 – n8
3970 Å n2 – n7
4102 Å n2 – n6
4340 Å n2 – n5
Balmer Hε Hδ Hγ Hβ Hα
Edge Hζ
3.40 eV 2.55 eV 1.89 eV Photon
3.19 eV Energies Ep [eV]
3.12 eV
3.02 eV
2.86 eV
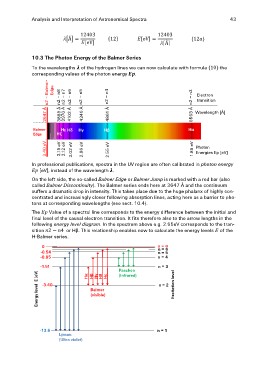
In professional publications, spectra in the UV region are often calibrated in photon energy
[eV], instead of the wavelength .
On the left side, the so-called Balmer Edge or Balmer Jump is marked with a red bar (also
called Balmer Discontinuity). The Balmer series ends here at 3647 Å and the continuum
suffers a dramatic drop in intensity. This takes place due to the huge phalanx of highly con-
centrated and increasingly closer following absorption lines, acting here as a barrier to pho-
tons at corresponding wavelengths (see sect. 10.4).
The Value of a spectral line corresponds to the energy difference between the initial and
final level of the causal electron transition. It fits therefore also to the arrow lengths in the
following energy level diagram. In the spectrum above e.g. 2.55eV corresponds to the tran-
sition or Hβ. This relationship enables now to calculate the energy levels of the
H-Balmer series.
0 nnn === ∞56
-0.54 n=4
-0.85
-1.51 Paschen n=3
(Infrared)
Energy level E [eV]
-3.40 Hα Balmer n=2
Hβ(visible)
Hγ
Hδ
Hε
Excitation level
-13.6 Lyman n=1
(Ultra violet)