
Page 48 - analysis-and-interpretation-of-astronomical-sp
P. 48
Analysis and Interpretation of Astronomical Spectra 48
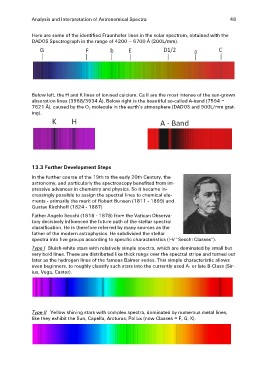
Here are some of the identified Fraunhofer lines in the solar spectrum, obtained with the
DADOS Spectrograph in the range of 4200 – 6700 Å (200L/mm).
Below left, the H and K lines of ionised calcium. Ca II are the most intense of the sun-grown
absorption lines (3968/3934 Å). Below right is the beautiful so-called A-band (7594 –
7621 Å), caused by the O2 molecule in the earth’s atmosphere (DADOS and 900L/mm grat-
ing).
13.3 Further Development Steps
In the further course of the 19th to the early 20th Century, the
astronomy, and particularly the spectroscopy benefited from im-
pressive advances in chemistry and physics. So it became in-
creasingly possible to assign the spectral lines to chemical ele-
ments - primarily the merit of Robert Bunsen (1811 - 1899) and
Gustav Kirchhoff (1824 - 1887)
Father Angelo Secchi (1818 - 1878) from the Vatican Observa-
tory decisively influenced the future path of the stellar spectral
classification. He is therefore referred by many sources as the
father of the modern astrophysics. He subdivided the stellar
spectra into five groups according to specific characteristics (I-V “Secchi Classes”).
Type I Bluish-white stars with relatively simple spectra, which are dominated by small but
very bold lines. These are distributed like thick rungs over the spectral stripe and turned out
later as the hydrogen lines of the famous Balmer series. This simple characteristic allows
even beginners, to roughly classify such stars into the currently used A- or late B-Class (Sir-
ius, Vega, Castor).
Type II Yellow shining stars with complex spectra, dominated by numerous metal lines,
like they exhibit the Sun, Capella, Arcturus, Pollux (now Classes ≈ F, G, K).