
Page 23 - Geelong business trends 2017_digital_Neat
P. 23
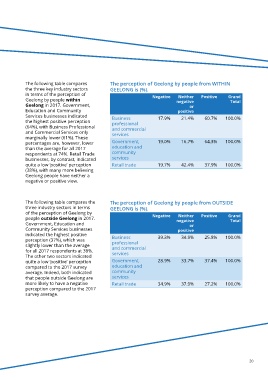
The following table compares          The perception of Geelong by people from WITHIN
            the three key industry sectors        GEELONG is (%).
            in terms of the perception of                            Negative   Neither   Positive    Grand
            Geelong by people within                                           negative                Total
            Geelong in 2017. Government,                                             or
            Education and Community                                             positive
            Services businesses indicated          Business            17.9%      21.4%     60.7%    100.0%
            the highest positive perception        professional
            (64%), with Business Professional      and commercial
            and Commercial Services only           services
            marginally lower (61%). These
            percentages are, however, lower        Government,         19.0%      16.7%     64.3%    100.0%
            than the average for all 2017          education and
            respondents at 74%. Retail Trade       community
            businesses, by contrast, indicated     services
            quite a low ‘positive’ perception      Retail trade        19.7%      42.4%     37.9%    100.0%
            (38%), with many more believing
            Geelong people have neither a
            negative or positive view.


            The following table compares the      The perception of Geelong by people from OUTSIDE
            three industry sectors in terms       GEELONG is (%).
            of the perception of Geelong by                          Negative   Neither   Positive    Grand
            people outside Geelong in 2017.                                    negative                Total
            Government, Education and                                                or
            Community Services businesses                                       positive
            indicated the highest positive         Business            39.3%      34.9%     25.8%    100.0%
            perception (37%), which was            professional
            slightly lower than the average        and commercial
            for all 2017 respondents at 38%.       services
            The other two sectors indicated
            quite a low ‘positive’ perception      Government,         28.9%      33.7%     37.4%    100.0%
            compared to the 2017 survey            education and
            average. Indeed, both indicated        community
            that people outside Geelong are        services
            more likely to have a negative         Retail trade        34.9%      37.9%     27.2%    100.0%
            perception compared to the 2017
            survey average.


                                                                                                                20