
Page 25 - Geelong business trends 2017_digital_Neat
P. 25
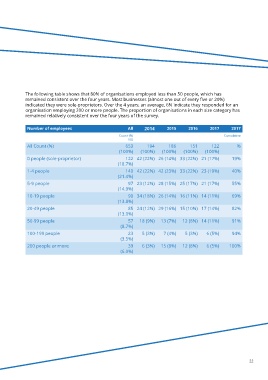
The following table shows that 80% of organisations employed less than 50 people, which has
            remained consistent over the four years. Most businesses (almost one out of every five or 20%)
            indicated they were sole-proprietors. Over the 4 years, an average, 6% indicate they responded for an
            organisation employing 200 or more people. The proportion of organisations in each size category has
            remained relatively consistent over the four years of the survey.


             Number of employees                          All    2014      2015      2016     2017      2017
                                                      Count (%)                                      Cumulative
                                                          ALL
             All Count (%)                               653      194       186      151       122        %
                                                      (100%)   (100%)    (100%)    (100%)   (100%)
             0 people (sole-proprietor)                  122  42 (22%)  26 (14%)  33 (22%)  21 (17%)    19%
                                                     (18.7%)
             1-4 people                                  140  42 (22%)  42 (23%)  33 (22%)  23 (19%)    40%
                                                     (21.4%)
             5-9 people                                   97  23 (12%)  28 (15%)  25 (17%)  21 (17%)    55%
                                                     (14.9%)
             10-19 people                                 90  34 (18%)  26 (14%)  16 (11%)  14 (11%)    69%
                                                     (13.8%)
             20-49 people                                 85  24 (12%)  29 (16%)  15 (10%)  17 (14%)    82%
                                                     (13.0%)
             50-99 people                                 57   18 (9%)   13 (7%)   12 (8%)  14 (11%)    91%
                                                       (8.7%)
             100-199 people                               23    5 (3%)    7 (4%)   5 (3%)    6 (5%)     94%
                                                       (3.5%)
             200 people or more                           39    6 (3%)   15 (8%)   12 (8%)   6 (5%)    100%
                                                       (6.0%)


                                                                                                                22