
Page 24 - Geelong business trends 2017_digital_Neat
P. 24
ABOUT THE SURVEY
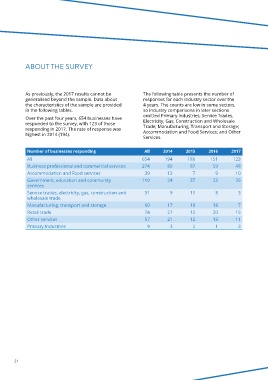
As previously, the 2017 results cannot be The following table presents the number of
generalised beyond the sample. Data about responses for each industry sector over the
the characteristics of the sample are provided 4 years. The counts are low in some sectors,
in the following tables. so industry comparisons in later sections
omitted Primary Industries; Service Trades,
Over the past four years, 654 businesses have
responded to the survey, with 123 of those Electricity, Gas, Construction and Wholesale
responding in 2017. The rate of response was Trade; Manufacturing, Transport and Storage;
highest in 2014 (194). Accommodation and Food Services; and Other
Services.
Number of businesses responding All 2014 2015 2016 2017
All 654 194 186 151 123
Business professional and commercial services 274 80 87 59 48
Accommodation and Food services 39 13 7 9 10
Government, education and community 110 24 37 23 26
services
Service trades, electricity, gas, construction and 31 9 11 8 3
wholesale trade
Manufacturing, transport and storage 60 17 18 18 7
Retail trade 74 27 12 20 15
Other services 57 21 12 13 11
Primary Industries 9 3 2 1 3
21