
Page 56 - Human Environment Interface (3)
P. 56
Brain Barrier Integrity and Development in the Rat
annotation and manual curation was used to select genes encoding w/v sterile isotonic saline were made in anaesthetised (inhaled
proteins that form part of a cell junction. Gene ontology isofluorane) pregnant or non-pregnant rats, using either a glass
descriptions for rat were downloaded from Biomart [20], and microcapillary with outer diameter 50–70 mm (E15 embryos) or
genes with ‘‘junction’’ mentioned in their gene ontology descrip- 30-gauge needle (adults) and left for 40 minutes. In adult animals,
tion were selected. Junction genes of interest were then extracted a double nephrectomy was performed to halt excretion of the
from this list. Similar searches were carried for other functional marker in the urine. Intrathecal injections of BDA or BED
categories as described in the Results/Discussion below. For initial (Molecular Probes) at a dose of 0.2 mg/g body weight in 0.9% w/
analysis genes with .100 sequence reads and age-related fold v sterile isotonic saline were made using a glass microcapillary
changes (FC) .2.0 (log2FC .1.0) were collated and are (outer diameter 50–70 mm) and left for 10 minutes. A 30-gauge
summarised in Tables 1, 2, 3, 4. For more specific analysis of needle was used to first pierce the skull and dura and a small
some particular function categories a lower cut-off of 10 sequence volume of CSF removed (approximately 1.5 ml) before injection.
reads was used. Illumina RNA sequencing data have been In addition, an incision was made in the dura of the lumbar region
deposited with the Gene Expression Omnibus (http://www.ncbi. of the spinal cord to prevent a pressure rise in the ventricles. For
nlm.nih.gov/geo/) under accession code GSE44072. intrathecal injections, the choroid plexus on the contralateral side
was investigated to ensure no effects due to surgical damage had
Microarray influenced the results. Control animals received an injection of
Microarray data obtained from E19 and adult Sprague-Dawley 0.9% w/v sterile isotonic saline. The volume of injection did not
exceed that of CSF removed.
rats were obtained from a dataset described in another study [24]
with accession number GSE44056. Tissue was collected and Biotinylated dextran amine, light microscopy
processed for microarray in the same manner as that for RNA-Seq Tissue for light microscopy was collected from terminally
(see above). These data are expressed as fold change (compared to
adult) in line with the presented RNA-Seq data. anesthetised E15 and adult animals (inhaled isoflurane, Veterinary
Companies of Australia) and fixed in 4% paraformaldehyde with
Physiological experiments 2.5% glutaraldehyde in 0.1 M phosphate buffer (pH 7.4) for 3
To investigate whether or not movement of passive permeability hours at 4uC. Once fixed, tissue was washed in phosphate buffer
(3610 minutes), embedded in 4% agar and 10 mm sections cut on
markers occurs through tight junctions between intimately a vibrating microtome (Leica, Wetlzar, Germany). Sections were
apposed choroid plexus epithelial cells, E15 and adult rats were floated in phosphate buffer and endogenous peroxidase activity
injected with biotinylated markers on either the blood side blocked with peroxidase blocking solution (DAKO, Glostrup,
(intraperitoneal injection) or CSF side (intrathecal injection) of Denmark) for 2 hours at room temperature. Sections were then
the lateral ventricular choroid plexus. For intraperitoneal injec- washed in phosphate buffer (3610 minutes) and stained with an
tions, solutions of biontinylated dextran amine (BDA, MW avidin-biotin complex (ABC Kit, DAKO) overnight at 4uC. The
3000Da, Molecular Probes/Life Technologies, Grand Island, following day, sections were washed in phosphate buffer (3610
NY, USA) at a dose of 0.7 mg/g body weight dissolved in 0.9%
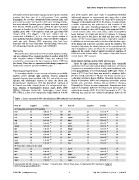
Table 1. Genes associated with choroid plexus differentiation and development.
Gene ID Log2(FC) p value FC Gene ID Log2(FC) p value FC
(A) Transcripts enriched in E15 embryos 302 E2f3 3.5 1.17610218 11
186 Shh 2.7 8.2761023 6.6
Emx1 8.2 9.78610246 130 Tgfb1i1 2.4 1.01610218 5.2
95 Wnt4 2.3 5.52610217 5.1
E2f7 7.5 7.456102123 53 Tgfb1 2.3 1.21610218 4.9
44 Wnt5a 2.1 3.58610218 4.2
Lef1 7.0 1.12610271 39 Trim28 1.9 1.17610216 3.8
22 Fzd7 1.8 6.64610214 3.4
Nog 6.6 2.61610253 19 Maf 1.6 1.14610211 3.0
16 Six3 1.5 1.8361029 2.7
E2f8 5.7 1.74610264 15 Ctnnb1 1.3 7.3461029 2.5
13 Smo 1.0 5.3261025 2.0
Bmp8a 5.5 3.77610211
12 Sox10 1.8 7.1461024 3.4
Irx5 5.3 1.1461029 7.3 Ppp3r1 1.5 1.03610210 2.8
4.9 Tgfbr2 1.4 3.7661029 2.6
Gli3 4.4 1.68610263 3.7 RGD1560225 1.2 1.6461026 2.4
3.6 Twsg1 1.1 9.2561027 2.1
Hsf4 4.2 2.57610214
Bmp5 4.0 7.77610246
Snai1 3.9 1.13610240
Notch1 3.7 1.53610247
(B) Transcripts enriched in the adult
Bmp15 3.5 7.47610224
Msx1 2.9 1.04610233
Igf1 2.3 5.82610221
Bmp6 1.9 9.326 10216
Bmp2 1.9 3.19610211
Only transcripts with fold change (FC) .2.0 (log2FC .1.0) and p value ,0.05 are shown above. A comprehensive list is presented in Table S2.
doi:10.1371/journal.pone.0065629.t001
PLOS ONE | www.plosone.org 3 July 2013 | Volume 8 | Issue 7 | e65629