
Page 57 - Human Environment Interface (3)
P. 57
Brain Barrier Integrity and Development in the Rat
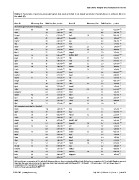
Table 2. Transcripts of junction-associated genes that were enriched in rat lateral ventricular choroid plexus in embryos (A) or in
the adult (B).
Gene ID Microarray E19 RNA-Seq E15 p value Gene ID Microarray E19 RNA-Seq E15 p value
(A) Transcripts enriched in embryos 163 2.55610274 Cadm3 - 7.2 4.52610225
74 5.63610217 Fat1 - 6.6 1.21610230
Col17a1 8.0 43 6.67610248 Pvrl2 1.8 5.0 8.81610223
38 2.60610273 Tmem204 - 4.5 1.80610217
Nox4 - 34 3.42610257 Lpp - 4.3 3.91610215
30 6.93610263 Pvrl1 - 4.2 1.25610216
Cacng4 - 30 3.63610221 Ptpru 2.5 3.2 1.34610212
29 1.79610272 Pdlim7 1.6 3.2 3.00610212
Palld - 27 1.33610230 Arhgef2 1.3 3.0 1.92610211
24 9.06610248 D3ZXQ2_RAT - 2.9 2.29610210
Pcdh12 - 18 5.25610254 PVR 1.1 2.9 3.9361029
18 5.08610254 Csda 2.3 2.9 7.02610211
Mip - 16 6.50610245 Ldb1 1.3 2.9 6.96610211
15 1.68610239 Amotl1 1.4 2.8 1.0461029
Cldn8 - 15 1.41610242 Jup 2.4 2.7 1.6061029
14 2.26610245 Jam2 - 2.6 4.64610210
Cdh5 3.5 14 3.21610237 Dpp4 - 2.4 4.4961023
13 1.53610247 Csk 1.4 2.4 1.6761029
Wnt11 - 11 5.77610243 Ada - 2.3 4.0161025
10 3.25610238 Cdh2 1.2 2.2 1.1461026
Panx1 1.5 8.8 7.57610228 Amotl2 - 2.2 1.4361026
8.6 5.90610211 Hdac7 0.9 2.1 6.7361026
Asam 12 8.4 3.24610223 Prkd1 - 2.1 1.4661025
7.4 1.53610229 Ttbk1 - 2.1 4.5161024
Itga5 - 7.4 2.03610233 Baiap2 1.6 2.1 2.6861025
7.2 5.45610231 Cxadr 1.7 2.1 9.9061026
Amot 1.4 7.2 2.32610220 Itgb1 2.4 2.0 1025
Gja4 5.0 158 1.94610238 Ocln 0.7 3.4 1.65610214
20 5.60610262 Dsg2 - 3.1 4.65610212
Ctnd2 - 20 6.82610264 Vamp1 1.2 3.1 2.2261029
19 3.36610264 Cgn - 3.1 5.95610212
Cldn6 8.5 11 4.77610244 D4A4T5_RAT - 2.9 3.91610210
9.7 5.68610242 Baiap2l1 1.8 2.7 5.25610210
Col13a1 - 9.1 1.85610239 Fh1 1.3 2.7 1.2861029
8.4 8.59610237 Epcam - 2.6 1.2061028
Notch1 5.3 6.8 2.80610222 Psmb1 1.5 2.6 4.5561029
6.4 3.18610228 Heg1 - 2.5 1.3961028
Vangl2 - 6.0 3.17610227 Rhg17 - 2.4 1.1761027
5.8 7.08610225 Numb 2.0 2.3 3.3961027
Esam - 5.4 1.42610224 Cldn9 2.9 2.3 8.2461026
4.9 9.07610222 Cnst - 2.2 1.0561026
Pgm5 - 4.9 1.47610222 Plekha7 - 2.1 4.0861026
4.7 1.11610221 Adam15 2.0 2.1 6.9261026
Calb2 - 4.2 2.00610218 Arhgap24 - 2.0 1.9861025
3.7 4.25610215
Adcyap1r1 -
Numbl 4.0
Gja1 9.7
Itga6 6.7
Gja5 3.8
(B) Transcripts enriched in the adult
Hnf4a -
Aqp4 3.8
Dsp 2.8
Cldn2 2.3
Cldn19 1.2
Cgnl1 -
Trpv4 2.4
Pdzd2 -
Cldn22 1.9
Mpp7 -
Synm -
Pkp2 1.9
F11r 2.1
Tbc1d2 1.5
Tmem47 -
Jam3 1.0
Prkcz 3.8
Dsc2 0.9
RNA-Seq data are a comparison of E15 and adult. Microarray data are from a previously published study [14] and are a comparison of E19 and adult (hyphens represent
transcripts that were not present on the microarray chip). Only transcripts with fold change (FC) .2.0 (log2FC .1.0) and p value ,0.05 are shown above. A
comprehensive list is presented in Table S2.
doi:10.1371/journal.pone.0065629.t002
PLOS ONE | www.plosone.org 4 July 2013 | Volume 8 | Issue 7 | e65629