
Page 25 - Human Environment Interface (4)
P. 25
Surface Chemistry Directs Protein Remodeling
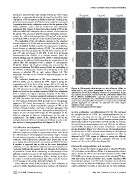
bands were quantified by image analysis making use of the Otsu’s Figure 2. Fibronectin distribution on the different SAMs as
algorithm to systematically identify the band borders [26]. Each observed by the phase magnitude in AFM. The protein was
experiment of FN adsorption on SAMs included the loading in the adsorbed for 10 min from different solutions of concentration 20 mg/
gel of two known amounts of FN (reference points) that correspond mL, 5 mg/mL and 2 mg/mL. The first row is the SAM surface without any
to points included in the calibration curve so that the position of the FN at different magnifications: 5 mm (a), 2 mm (b) and 1 mm (c).
whole calibration curve could be verified for each adsorption Arrowheads in f) identify one of the FN fibers assembled on the material
experiment [26]. Figure 1b shows the surface density of FN on the surface upon adsorption (fiber diameter 1365 nm), arrows in l) identify
different SAMs after adsorption from a solution of concentration globular aggregates of molecular size (diameter 2064 nm). Images
20 mg/mL. The amount of adsorbed protein diminishes monoton- including FN are 1 mm side.
ically as the –OH density increases from 225 ng/cm2 on the methyl doi:10.1371/journal.pone.0019610.g002
terminated SAM to 50 ng/cm2 on the hydroxyl terminated one.
survival, proliferation, and differentiation [30–34]. We examined
The availability of the cell adhesion domains in the adsorbed the phosphorylation of Y-397, the autophosphorylation site in
FN was evaluated by ELISA with monoclonal antibodies, which is FAK and a binding site for Src and PI-3 kinases [35,36].
a well established method to probe for structural or conforma- According to Figure 4 the level of FAK remains constant (both as
tional changes in adsorbed proteins [27,28]. The antibody used obtained by analysis of western-blot and PCR bands). By contrast,
(HFN7.1) was directed against the flexible linker between the 9th the ratio between phosphorylated and total FAKs on the different
and 10th type III repeats of FN [29]. It has been previously mixed SAMs decreases as the fraction of hydroxyl - terminated
demonstrated that HFN7.1 is a receptor-mimetic probe for groups diminishes (Figure 4c). That is to say, the phosphorylation
integrin binding and cell adhesion [29]. HFN7.1 antibody binding of specific sites in FAKs depends monotonically on the hydroxyl
is similar on the different SAMs regardless the composition of the content of the surface. Likewise, gene expression for FAK as
surface after FN adsorption from a solution of concentration obtained by RT-PCR shows no difference among the different
20 mg/mL (Figure 1c). However, taking into account that the surfaces, while integrin (b1) gene expression increases as the
amount of adsorbed FN differs among SAMs, the availability of fraction of OH on the SAMs does (Figure S4).
the HFN7.1 antibody was obtained by normalizing to the total
amount of adsorbed FN on each surface (Figure 1d). This Fibronectin reorganization and secretion
magnitude increases as the fraction of hydroxyl groups on the Figure 5 shows the cellular reorganization of adsorbed FN after
surface does.
2.5 h of culture on the different SAMs. It is observed that cells are
The molecular distribution of FN upon adsorption on the able to reorganize FN on the hydroxyl-terminated and the 70%-
different SAMs can be obtained by AFM. Figure 2 shows the OH SAMs, as it is shown by movements of the adsorbed FN layer
organization of FN on three of the surfaces (CH3, OH and the with dark zones in the pericellular area, mostly coincident with
surface with 70% OH, that display qualitatively different WCA) focal adhesion plaques. Late FN matrix formation was studied for
after FN adsorption from solutions of different concentrations. FN longer times on the different SAMs (Figure S5). It is observed that
fibrils are found on the methyl-terminated SAM after adsorption matrix production increases as time goes by on every substrate.
from a solution of 2 mg/mL (average thickness of the fiber is
approximately 1365 nm), less organized molecules are observed on
the 70% OH surface that became isolated globular-like molecules
on the hydroxyl terminated SAM (average size of the globular
aggregates 2064 nm). Increasing the concentration of the FN
solution results in a dense network-like structure of FN on the
methyl terminated surface and large molecular aggregates that
cover the whole surface for the more hydrophilic surfaces (Figure 2).
Figures S1, S2, S3 show AFM images for FN adsorption on the
different substrates at different magnifications for the sake of
completeness. The fibrillar nature of the adsorbed FN on the
methyl-terminated SAM and the globular distribution on the other
two surfaces is clearly grasped from this Figures S1, S2, S3.
Cell adhesion and signaling
The organization of proteins involved in the formation of focal
adhesion complexes provides an opportunity to learn more about
the effectiveness of cell-to-substrate interactions. Figure 3 shows
the distribution of vinculin in cells adhering on the different model
substrates. Well-defined focal adhesions were found only on the
more hydrophilic substrates (OH- terminated and 70% OH). Even
if vinculin is expressed also in cells on the more hydrophobic
substrates, it is not afterwards organized into focal contacts but
randomly distributed throughout the cell. Likewise, the formation
of prominent F-actin fibers terminating in well-developed focal
adhesion complexes occurs on the hydroxyl-terminated surfaces.
More dispersed actin distribution (either lacking stress fiber
formation or mostly peripheral staining) is observed as the fraction
of OH groups on the surface diminishes (Figure 3).
Focal adhesion kinase (FAK) localizes to focal adhesions to
activate multiple signaling pathways that regulate cell migration,
PLoS ONE | www.plosone.org 3 May 2011 | Volume 6 | Issue 5 | e19610