
Page 40 - Human Environment Interface (4)
P. 40
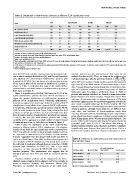
Multi-Interface Domain Analysis

Table 2. Distribution of multi-interface domains at different SCOP classification levels.

class                                    fold                            superfamily             family                        domain

All a proteins (349){                    Nall N  Nint 6                  Nall         Nint       Nall              Nint        Nall         Nint
All b proteins (577)                             89                                              772                           -{
a and b proteins (a/b) (684)             259     85                      459          128        679               174         -            255
a and b proteins (a+b) (662)             165     91                      331          138        736               207         -            336
Multi-domain proteins (45)               141     161                     232          137        897               293         -            527
Membrane and cell surface proteins (53)  334     21                      488          209        74                318         -            476
Small proteins (67)                      53      24                      53           21         104               26          -            36
Total                                    50      24                      92           35         202               38          -            43
                                         85      495                     122          29         3464              38          97178*       57
                                         1087                            1777         697                          1094                     1730

Nnumber of clusters under the given SCOP classification level;
unumber of clusters that have multi-interface proteins under the given SCOP classification level;
{number of protein chains that have multi-interfaces;
{data is not available in SCOP;

*the total number of domains is 97,178 in SCOP version 1.73, but the total number of domains listed above is slightly smaller since there are still four classes with very

few number of domains are not shown here.

SCOP version 1.73 instead of 1.75 is used in this study because the PDBeFold [34] is based on SCOP version 1.73, which is used to search SCOP to get similar domains for

a given protein.

doi:10.1371/journal.pone.0050821.t002

identified 873 multi-interface proteins based on structural exclu-             interface proteins into the aforementioned four types by the
sion in which similarity threshold is 0 [2], and Kar and coworkers
only obtained 79 cancer-related multi-interface proteins with                  method described in [47]. Then, we analyzed the preference for
threshold of 0.2 [43]. The distribution of multi-interface proteins                                                                         PNim          P ,Nia
of our data in terms of the number of interfaces of a protein is               each interaction  type,  with  the  preference  defined  as             =
shown in Table 1, indicating that most of the multi-interface                  where Nim is the                                                  Nim’          Nia’
proteins have a very small number of interfaces and only a few of
them have more than 5.                                                                           number of multi-interface protein interactions of

   Figure 4 is produced by PHYLIP [44] based on 2,517 of the                   type i and Nia is the whole number of interactions of type i in our
5,222 multi-interface proteins that have SCOP annotations. It
shows the number distribution of multi-interface proteins at                   data. This was followed by mining fingerprints of every interaction
different SCOP classification levels. Obviously, multi-interface
domains can appear in a broad range of clusters in terms of SCOP               type and exploring relations between fingerprints of different
classification. Among all the eleven classes in SCOP, a=b proteins,
azb proteins, all-b proteins, and all-a proteins account for 90.3%             interaction types. According to preferences shown in Table 3,
of all the multi-interface proteins. Figure 4 also indicates that all-b
proteins, or at least part of them, are less conservable since they            proteins with multiple interfaces are favored in homo-interactions
have the largest number of multi-interface proteins in one domain.
It can be also seen that multi-interface proteins with a large                 (homo-oligomer and homo-complex). Fingerprints mined from
variability tend to aggregate to a small number of clusters instead
of uniformly spread out to each cluster as shown in Figure 4.                  each type of interaction with a minimum frequency of 5% show

   Table 2 gives the distribution of the 2,517 multi-interface                 that homo-oligomers have 96 non-trivial fingerprints and that the
proteins at different levels of SCOP classification. The complete
number of sub-levels for each classification level is retrieved from           same number is significantly lower for hetero-complexes (9). This
SCOP [1], while the number of sub-levels with multiple interfaces
for each level is determined by the number of multi-interface                  indicates that interfaces of homo-oligomers share some common
domains ‘‘upgraded’’ from the domain level to the class level. It
can be seen from Figure 4 that, while multi-interface proteins exist           structural patterns, although homo-oligomers are different from
over all classes of SCOP classification, they clearly favor a few of
the sub-levels. In particular, although there are more than 110,000            each other, and interfaces of hetero-complexes rarely have
domains with annotation in SCOP [1], only a very small
proportion of these domains (1,730/97,178) have the multi-                     recurring structural patterns. Surprisingly, despite only 9 finger-
interface property. This phenomenon also suggests that all
biological processes have their own small set of pivotal proteins              prints mined from hetero-complexes, 4 of them are isomorphic to
[45].
                                                                               (other 4) fingerprints (of the 96 mined) from homo-oligomers. The
   Interfaces between proteins can be categorized into homo-
oligomer, homo-complex, hetero-oligomer and hetero-complex in                  p-value of this number of isomorphic fingerprints against randomly
terms of sequence similarity and interaction lifetime [46].
Therefore, we classified the interactions of the 5,222 multi-                  generated graph pairs is 6.7e-4. This shows that sharing of

                                                                               interface patterns between homo-oligomers and hetero-complexes

                                                                               is significantly more frequent than expected by chance. Due to a

                                                                               lack of homo-complex and hetero-oligomer interactions in multi-

                                                                               Table 3. Preference of multi-interface protein interactions of
                                                                               four interface types.

                                                                               Interface type    # interaction           # multi-interface  preference
                                                                                                                         interaction
                                                                               Homo-oligomer     647                                        1.42
                                                                               Homo-complex      13                      127                1.67
                                                                               Hetero-oligomer   38                      3                  0.76
                                                                               Hetero-complex    6695                    4                  0.96
                                                                                                                         890

                                                                               doi:10.1371/journal.pone.0050821.t003

PLOS ONE | www.plosone.org                                               6 December 2012 | Volume 7 | Issue 12 | e50821