
Page 61 - Human Environment Interface (4)
P. 61
Epigenetics of the Placenta
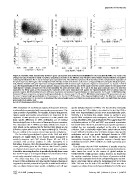
Figure 8. Genome wide relationship between gene expression and promoter methylation for (A) CVS and (B) MBC. The X axis is the
average log ratio of signal B to signal A of probes targeting each probe on the Infinium array. Negative values indicate hypomethylation and positive
values hypermethylation. The Y axis is the log2 gene expression level. The solid line represents the fitted values of the nonparametric regression of
the gene expression level against the methylation level. The two dashed vertical lines mark clusters of hypomethylated and hypermethylated genes.
C–E. Relation between CVS gene expression and hypomethylation level of various types of genomic regions in chromosomes 13, 18, and 21. The X
axis is the hypomethylation level of various genomic regions, measured as the log ratio of the signals from the control samples to the signal of the
HapII digested samples averaged over the probes targeting the same genomic region. The Y axis is the log2 gene expression level. The solid line
represents the fitted values of the nonparametric regression of the gene expression level against the hypomethylation level of various types of
genomic regions. (C) Relationship between CVS gene expression and promoter hypomethylation in chromosomes 13, 18, and 21. (D) Relationship
between CVS gene expression and gene body hypomethylation in chromosomes 13, 18, and 21. (E) Relationship between CVS gene expression and
the non-CGI gene body hypomethylation in Chromosomes 13, 18, and 21. (F) Box plots of the hypomethylation level of the MspI sites inside gene
bodies in Chromosomes 13, 18, and 21, as determined by custom Agilent arrays. Left: MspI sites inside gene bodies and CGIs. Right: MspI sites inside
gene bodies but outside CGIs.
doi:10.1371/journal.pone.0014723.g008
DNA methylation are not limited to regions of the genome that have specific biological function in MBCs. The fact that this relationship
traditionally been associated with tissue specific gene expression. This was less clear for CVS is likely to be related to the fact that CVS is
raises a number of possibilities. For example, it may be that genomic both more hypomethylated and also more transcriptionally active.
regions outside gene bodies and promoters are important for the Similarly, it is interesting that, despite almost no overlap in gene
regulation of tissue-specific gene expression. It is also possible that specific DNA methylation and transcription, we found ‘‘functional’’
tissue specific differences in DNA methylation are of minimal overlap identified by IPA analysis (Table S1). This suggests that DNA
functional significance in the context of tissue specific gene expression. methylation patterns in CVS and MBC may provide a permissive
The observation that T-DMRs are highly unlikely to be found in framework within which the potential for gene-specific expression is
CpG islands can be explained by the fact that CpG islands are, by enabled but not necessarily actualized at the time of sample
definition, regions where CpGs are hypomethylated[19]. Therefore, collection. Such a relationship might further explain why we found
they are unlikely to be common sites of tissue specific methylation. it more difficult to identify a clear correlation between tissue specific
methylation and cell type specific biological function in CVS.
The fact that hypomethylated regions of the CVS and MBC Specifically, it may be that the dynamic complexity of CVS
genomes are highly likely to be located inside (compared to transcription throughout early gestation requires a broadly hypo-
outside) promoters and CpG islands (Figure 4B and 4C) is methylated permissive DNA methylome to enable appropriate gene
consistent with previous analyses in other tissues[34]. It is expression.
interesting, however, that this phenomenon is also apparent in
exons, particularly given the fact that we also found a positive Our discovery that the DNA methylome is broadly related to
correlation between gene body methylation and gene expression. gene expression patterns is consistent with previous observations in
It would be interesting therefore to specifically identify those exons other tissues but novel in the context of global analysis in
that do NOT appear to be hypomethylated and determine if these CVS[10,38,39]. Unlike previous studies, however, we found that
are strongly associated with gene expression. the negative correlation between the degree of promoter methyl-
ation and the expression level of the corresponding gene was non-
The notion that there is an organized functional relationship linear, only being evident when the methylation level is less than
between DNA methylation and tissue-specific biological function is 50%. This was true for both CVS and MBC. There was also a
supported by the data presented in Figure 6A in which we identified a negative correlation between the hypomethylation level of the gene
clear correlation between tissue specific methylation and cell type
PLoS ONE | www.plosone.org 13 February 2011 | Volume 6 | Issue 2 | e14723