
Page 180 - Applied Statistics with R
P. 180
180 CHAPTER 9. MULTIPLE LINEAR REGRESSION
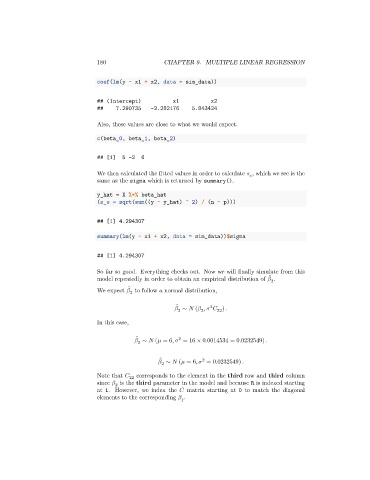
coef(lm(y ~ x1 + x2, data = sim_data))
## (Intercept) x1 x2
## 7.290735 -2.282176 5.843424
Also, these values are close to what we would expect.
c(beta_0, beta_1, beta_2)
## [1] 5 -2 6
We then calculated the fitted values in order to calculate , which we see is the
same as the sigma which is returned by summary().
y_hat = X %*% beta_hat
(s_e = sqrt(sum((y - y_hat) ^ 2) / (n - p)))
## [1] 4.294307
summary(lm(y ~ x1 + x2, data = sim_data))$sigma
## [1] 4.294307
So far so good. Everything checks out. Now we will finally simulate from this
̂
model repeatedly in order to obtain an empirical distribution of .
2
̂
We expect to follow a normal distribution,
2
̂
2
∼ ( , ) .
22
2
2
In this case,
̂
2
∼ ( = 6, = 16 × 0.0014534 = 0.0232549) .
2
̂
2
∼ ( = 6, = 0.0232549) .
2
Note that 22 corresponds to the element in the third row and third column
since is the third parameter in the model and because R is indexed starting
2
at 1. However, we index the matrix starting at 0 to match the diagonal
elements to the corresponding .
