
Page 183 - Applied Statistics with R
P. 183
9.5. SIMULATION 183
2.5
2.0
Density 1.5
1.0
0.5
0.0
5.6 5.8 6.0 6.2 6.4
^
β 2
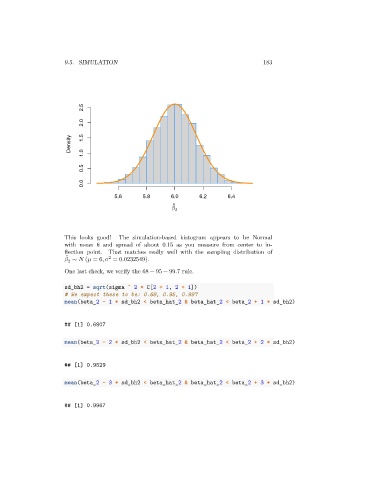
This looks good! The simulation-based histogram appears to be Normal
with mean 6 and spread of about 0.15 as you measure from center to in-
flection point. That matches really well with the sampling distribution of
̂
2
∼ ( = 6, = 0.0232549).
2
One last check, we verify the 68 − 95 − 99.7 rule.
sd_bh2 = sqrt(sigma ^ 2 * C[2 + 1, 2 + 1])
# We expect these to be: 0.68, 0.95, 0.997
mean(beta_2 - 1 * sd_bh2 < beta_hat_2 & beta_hat_2 < beta_2 + 1 * sd_bh2)
## [1] 0.6807
mean(beta_2 - 2 * sd_bh2 < beta_hat_2 & beta_hat_2 < beta_2 + 2 * sd_bh2)
## [1] 0.9529
mean(beta_2 - 3 * sd_bh2 < beta_hat_2 & beta_hat_2 < beta_2 + 3 * sd_bh2)
## [1] 0.9967