
Page 191 - Applied Statistics with R
P. 191
10.2. EXPLANATION VERSUS PREDICTION 191
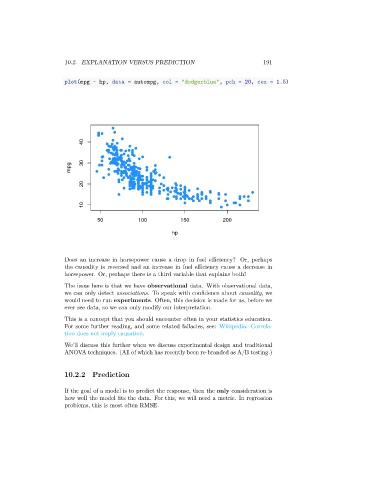
plot(mpg ~ hp, data = autompg, col = "dodgerblue", pch = 20, cex = 1.5)
40
mpg 30
20
10
50 100 150 200
hp
Does an increase in horsepower cause a drop in fuel efficiency? Or, perhaps
the causality is reversed and an increase in fuel efficiency cause a decrease in
horsepower. Or, perhaps there is a third variable that explains both!
The issue here is that we have observational data. With observational data,
we can only detect associations. To speak with confidence about causality, we
would need to run experiments. Often, this decision is made for us, before we
ever see data, so we can only modify our interpretation.
This is a concept that you should encounter often in your statistics education.
For some further reading, and some related fallacies, see: Wikipedia: Correla-
tion does not imply causation.
We’ll discuss this further when we discuss experimental design and traditional
ANOVA techniques. (All of which has recently been re-branded as A/B testing.)
10.2.2 Prediction
If the goal of a model is to predict the response, then the only consideration is
how well the model fits the data. For this, we will need a metric. In regression
problems, this is most often RMSE.