
Page 193 - Applied Statistics with R
P. 193
10.2. EXPLANATION VERSUS PREDICTION 193
Now, suppose we magically encounter some additional data. To truly asses how
well the model predicts, we should evaluate how well our models predicts the
response of this data. We will call this data the test data and this RMSE the
test RMSE.
• Train RMSE: model fit on seen data, evaluated on seen data
• Test RMSE: model fit on seen data, evaluated on unseen data
Below, we simulate some data and fit two models. We will call the solid blue
line the “simple” model. The dashed orange line will be called the “complex”
model, which was fit with methods we do not yet know.
Simulated Train Data Simulated Test Data
8 8
6 6
4 4
Response 2 Response 2
0 0
-2 -2
-4 -4
0 2 4 6 8 10 0 2 4 6 8 10
Predictor Predictor
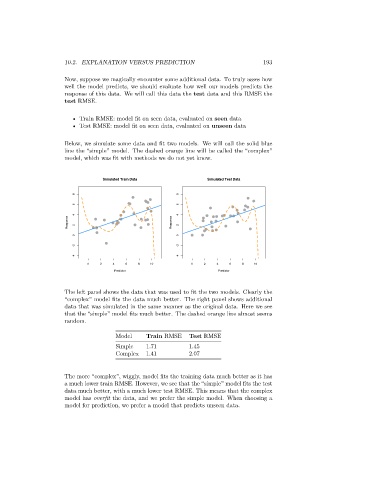
The left panel shows the data that was used to fit the two models. Clearly the
“complex” model fits the data much better. The right panel shows additional
data that was simulated in the same manner as the original data. Here we see
that the “simple” model fits much better. The dashed orange line almost seems
random.
Model Train RMSE Test RMSE
Simple 1.71 1.45
Complex 1.41 2.07
The more “complex”, wiggly, model fits the training data much better as it has
a much lower train RMSE. However, we see that the “simple” model fits the test
data much better, with a much lower test RMSE. This means that the complex
model has overfit the data, and we prefer the simple model. When choosing a
model for prediction, we prefer a model that predicts unseen data.