
Page 233 - Applied Statistics with R
P. 233
12.2. TWO-SAMPLE T-TEST 233
• The observations follow a normal distribution. The mean of each group
is different.
• Equal variance for each group.
• Independence. Which is believable if groups were randomly assigned.
Later, we will investigate the normal and equal variance assumptions. For now,
we will continue to assume they are reasonable.
The natural question to ask: Is there a difference between the two groups? The
specific question we’ll answer: Are the means of the two groups different?
Mathematically, that is
∶ = 2 vs ∶ ≠ 2
1
1
1
0
For the stated model and assuming the null hypothesis is true, the test statistic
would follow a distribution with degrees of freedom + − 2.
1
2
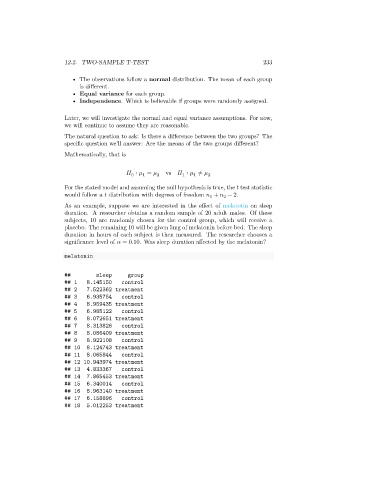
As an example, suppose we are interested in the effect of melatotin on sleep
duration. A researcher obtains a random sample of 20 adult males. Of these
subjects, 10 are randomly chosen for the control group, which will receive a
placebo. The remaining 10 will be given 5mg of melatonin before bed. The sleep
duration in hours of each subject is then measured. The researcher chooses a
significance level of = 0.10. Was sleep duration affected by the melatonin?
melatonin
## sleep group
## 1 8.145150 control
## 2 7.522362 treatment
## 3 6.935754 control
## 4 8.959435 treatment
## 5 6.985122 control
## 6 8.072651 treatment
## 7 8.313826 control
## 8 8.086409 treatment
## 9 8.922108 control
## 10 8.124743 treatment
## 11 8.065844 control
## 12 10.943974 treatment
## 13 4.833367 control
## 14 7.865453 treatment
## 15 6.340014 control
## 16 8.963140 treatment
## 17 6.158896 control
## 18 5.012253 treatment