
Page 238 - Applied Statistics with R
P. 238
238 CHAPTER 12. ANALYSIS OF VARIANCE
Truth Observed Data
0.4
5
0.3
density 0.2 response 0
0.1
-5
0.0
-5 0 5 A B C
observations group
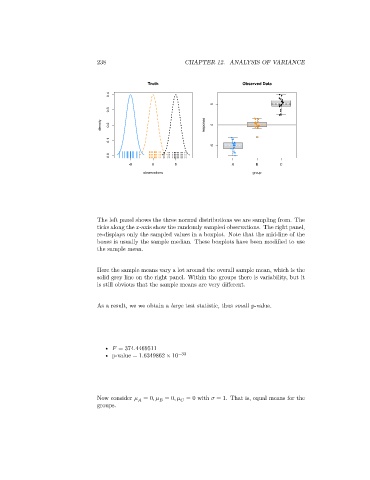
The left panel shows the three normal distributions we are sampling from. The
ticks along the -axis show the randomly sampled observations. The right panel,
re-displays only the sampled values in a boxplot. Note that the mid-line of the
boxes is usually the sample median. These boxplots have been modified to use
the sample mean.
Here the sample means vary a lot around the overall sample mean, which is the
solid grey line on the right panel. Within the groups there is variability, but it
is still obvious that the sample means are very different.
As a result, we we obtain a large test statistic, thus small p-value.
• = 374.4469511
• p-value = 1.6349862 × 10 −33
Now consider = 0, = 0, = 0 with = 1. That is, equal means for the
groups.