
Page 289 - Applied Statistics with R
P. 289
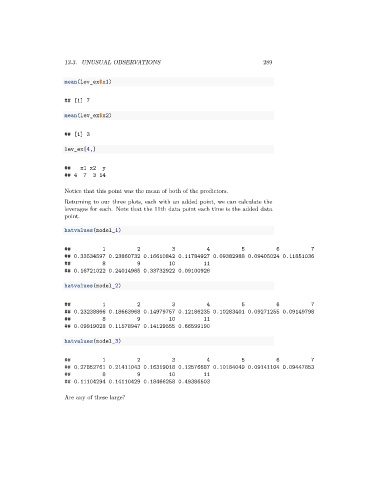
13.3. UNUSUAL OBSERVATIONS                                        289


                      mean(lev_ex$x1)


                      ## [1] 7

                      mean(lev_ex$x2)


                      ## [1] 3

                      lev_ex[4,]


                      ##    x1 x2  y
                      ## 4   7  3 14

                      Notice that this point was the mean of both of the predictors.
                      Returning to our three plots, each with an added point, we can calculate the
                      leverages for each. Note that the 11th data point each time is the added data
                      point.

                      hatvalues(model_1)


                      ##           1          2           3          4           5          6           7
                      ## 0.33534597 0.23860732 0.16610842 0.11784927 0.09382988 0.09405024 0.11851036
                      ##           8          9          10         11
                      ## 0.16721022 0.24014985 0.33732922 0.09100926

                      hatvalues(model_2)


                      ##           1          2           3          4           5          6           7
                      ## 0.23238866 0.18663968 0.14979757 0.12186235 0.10283401 0.09271255 0.09149798
                      ##           8          9          10         11
                      ## 0.09919028 0.11578947 0.14129555 0.66599190

                      hatvalues(model_3)


                      ##           1          2           3          4           5          6           7
                      ## 0.27852761 0.21411043 0.16319018 0.12576687 0.10184049 0.09141104 0.09447853
                      ##           8          9          10         11
                      ## 0.11104294 0.14110429 0.18466258 0.49386503

                      Are any of these large?