
Page 293 - Applied Statistics with R
P. 293
13.3. UNUSUAL OBSERVATIONS 293
1 ℎ
= 2 1 − ℎ .
Notice that this is a function of both leverage and standardized residuals.
A Cook’s Distance is often considered large if
4
>
and an observation with a large Cook’s Distance is called influential. This is
again simply a heuristic, and not an exact rule.
The Cook’s distance for each point of a regression can be calculated using
cooks.distance() which is a default function in R. Let’s look for influential
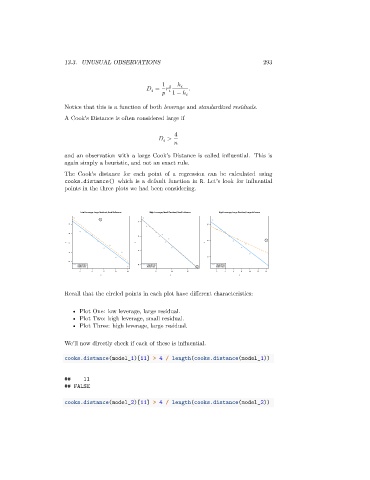
points in the three plots we had been considering.
Low Leverage, Large Residual, Small Influence High Leverage, Small Residual, Small Influence High Leverage, Large Residual, Large Influence
10
10 10
8
5
5
y y y
6
0
4
0
2
Original Data -5 Original Data Original Data
Added Point Added Point Added Point
2 4 6 8 10 5 10 15 2 4 6 8 10 12 14
x x x
Recall that the circled points in each plot have different characteristics:
• Plot One: low leverage, large residual.
• Plot Two: high leverage, small residual.
• Plot Three: high leverage, large residual.
We’ll now directly check if each of these is influential.
cooks.distance(model_1)[11] > 4 / length(cooks.distance(model_1))
## 11
## FALSE
cooks.distance(model_2)[11] > 4 / length(cooks.distance(model_2))